
Adding a Google Analytics Report to the Dashboard
From version 8.3.16, Terminalfour will support Google Analytics 4. In that version, we’ll also remove support for Google Analytics Dashboards (this doesn’t apply to the Dashboards Module, which we don’t intend to remove). We will keep Google Analytics page stats in Direct Edit so your editors can see how a page performs.
While the Google Analytics Dashboard lets Terminalfour users see how your site performed directly in the product, it wasn't straightforward to set up. There are now easier ways to show Google Analytics data in the product.
In this article, we’ll learn how to use Google Looker Studio (formerly Google Data Studio) to show Google Analytics data as an iFrame using the Terminalfour Dashboard. Check out this guide if you haven’t already installed the Terminalfour Dashboards Module.
The report
In this example, we’ll use a sample report from Google Looker Studio:
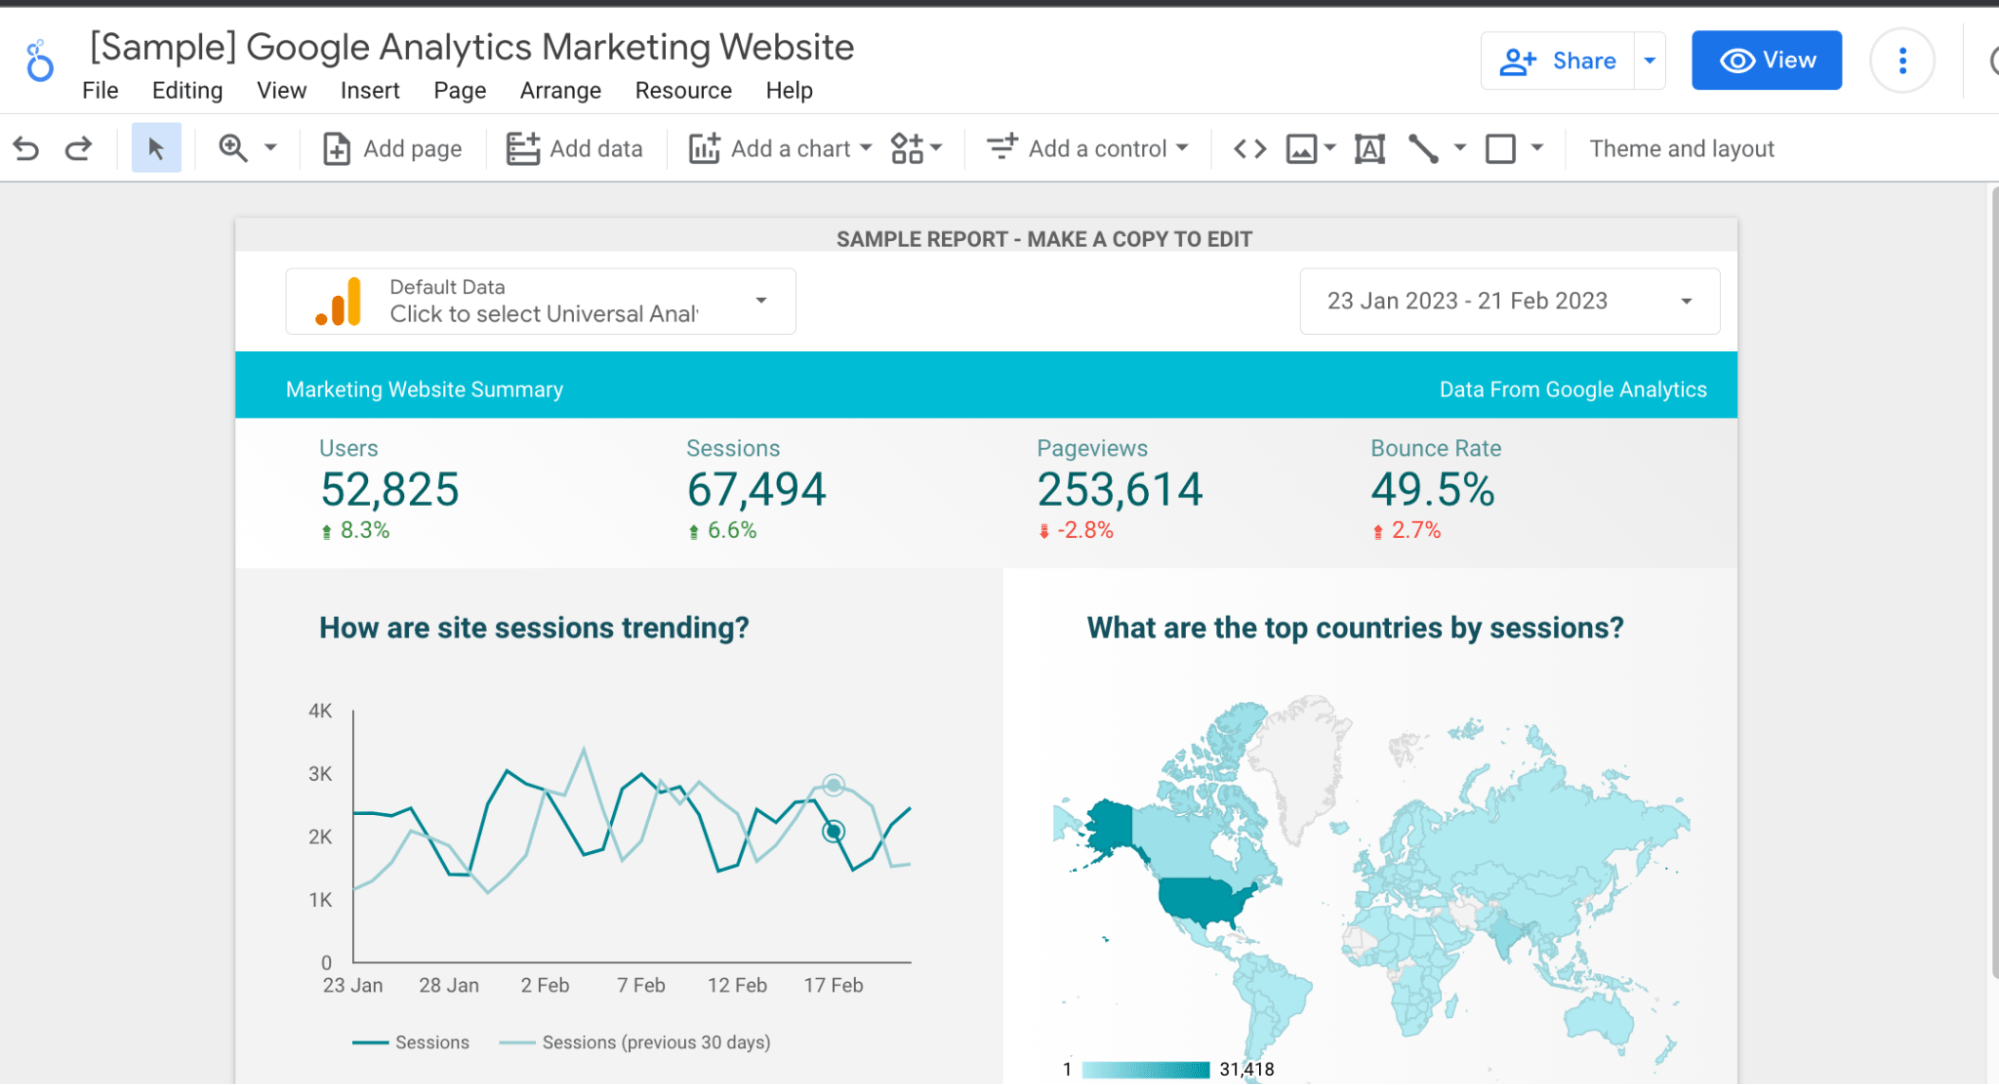
Google have a useful article on setting up your report that’s worth checking out.
To make sure that your report is visible, click Share, and from the modal, select the users you would like to see the report when it’s embedded in the Dashboard (those users will have to be logged on with their Google account to see the chart).
You can also set the Link settings to Unlisted (Public but not indexed by Google) or Public (anyone on the internet with the link can find and view the report)
If your organisation uses Google Workspace, then you’ll have even more options.
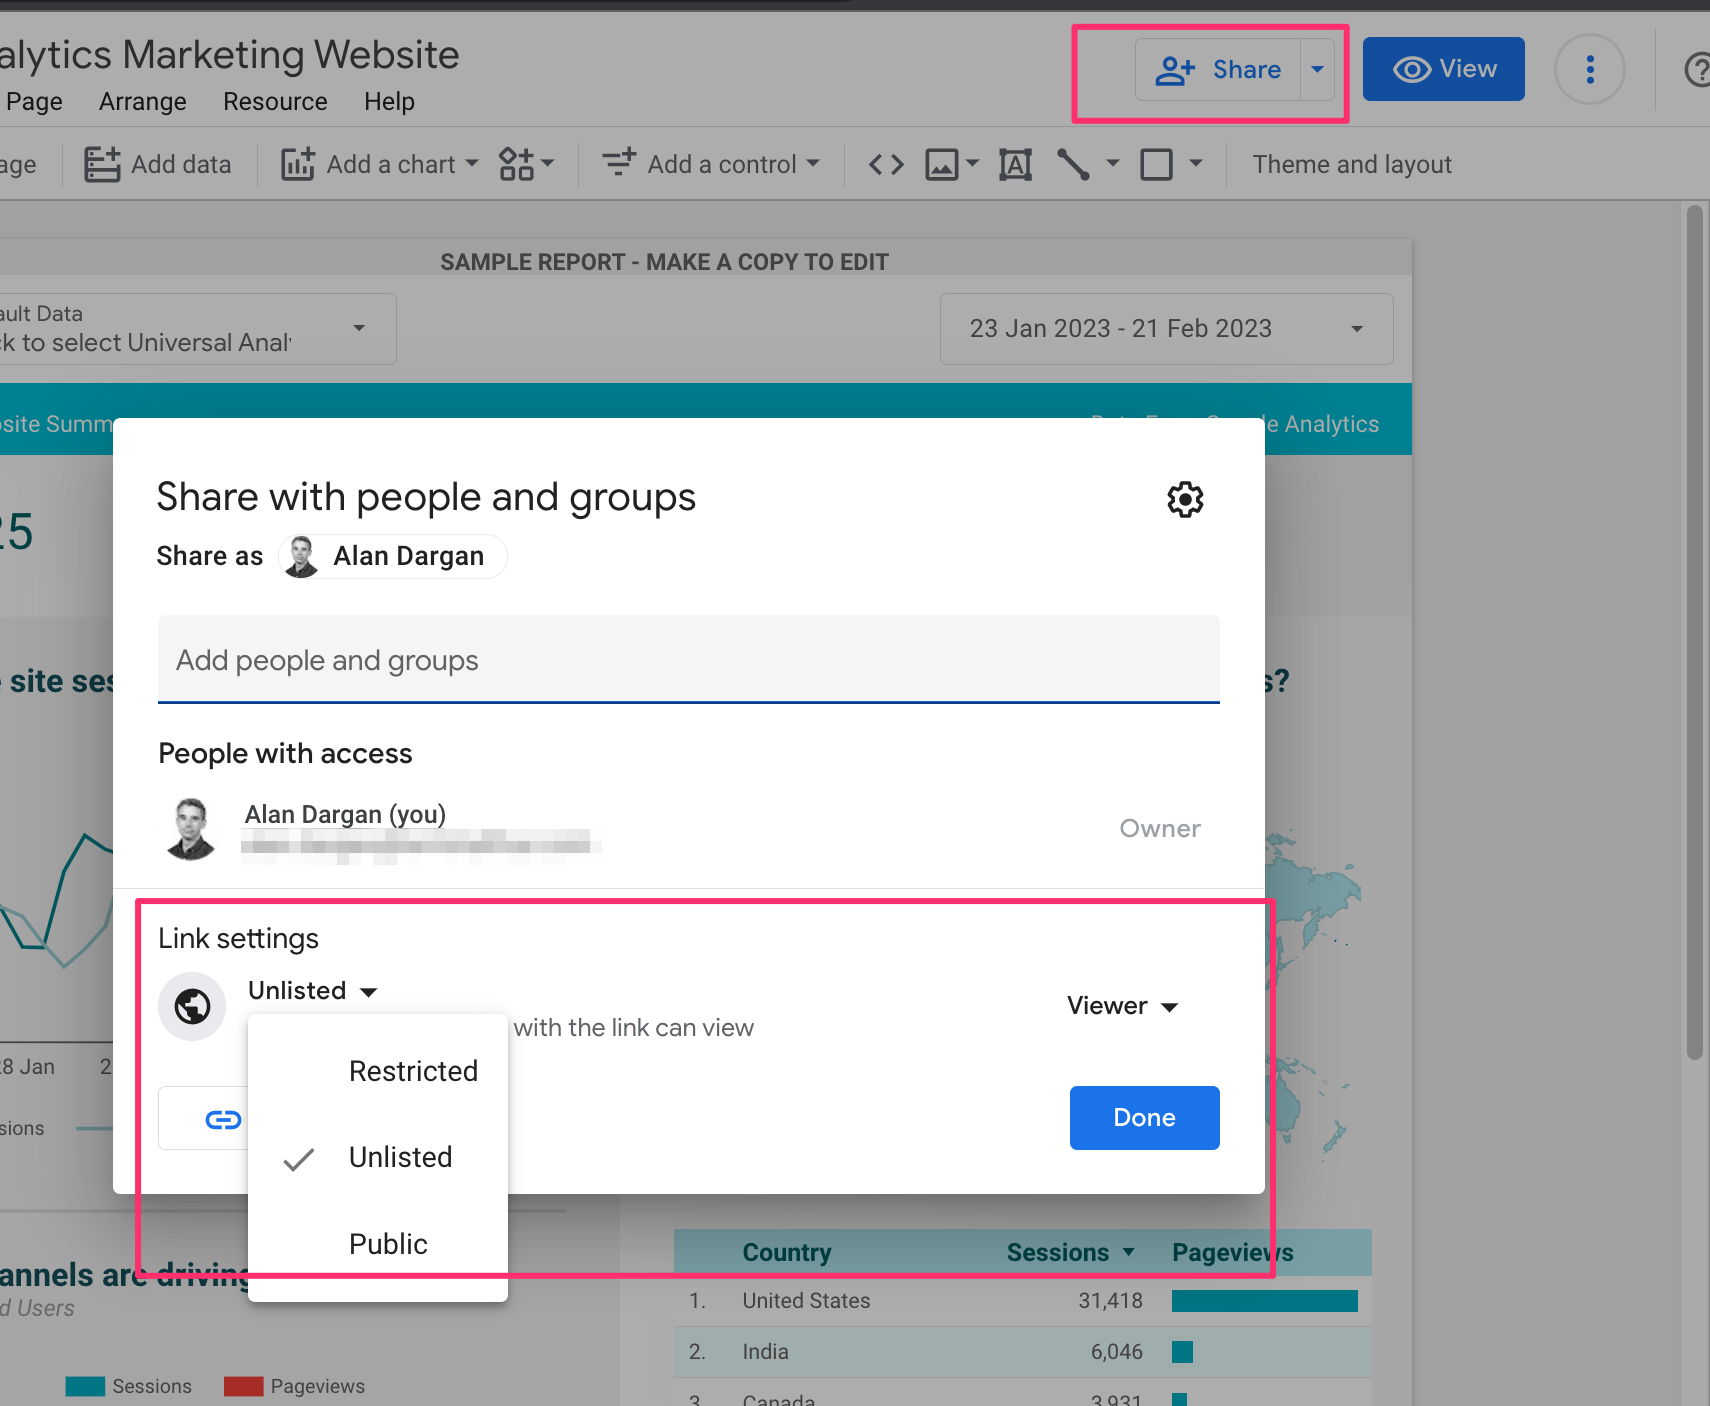
Click Done when you’re finished.
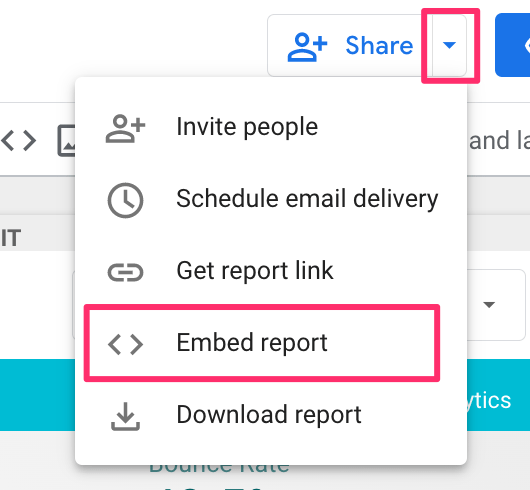
Click on the Share dropdown and select the Embed report option.
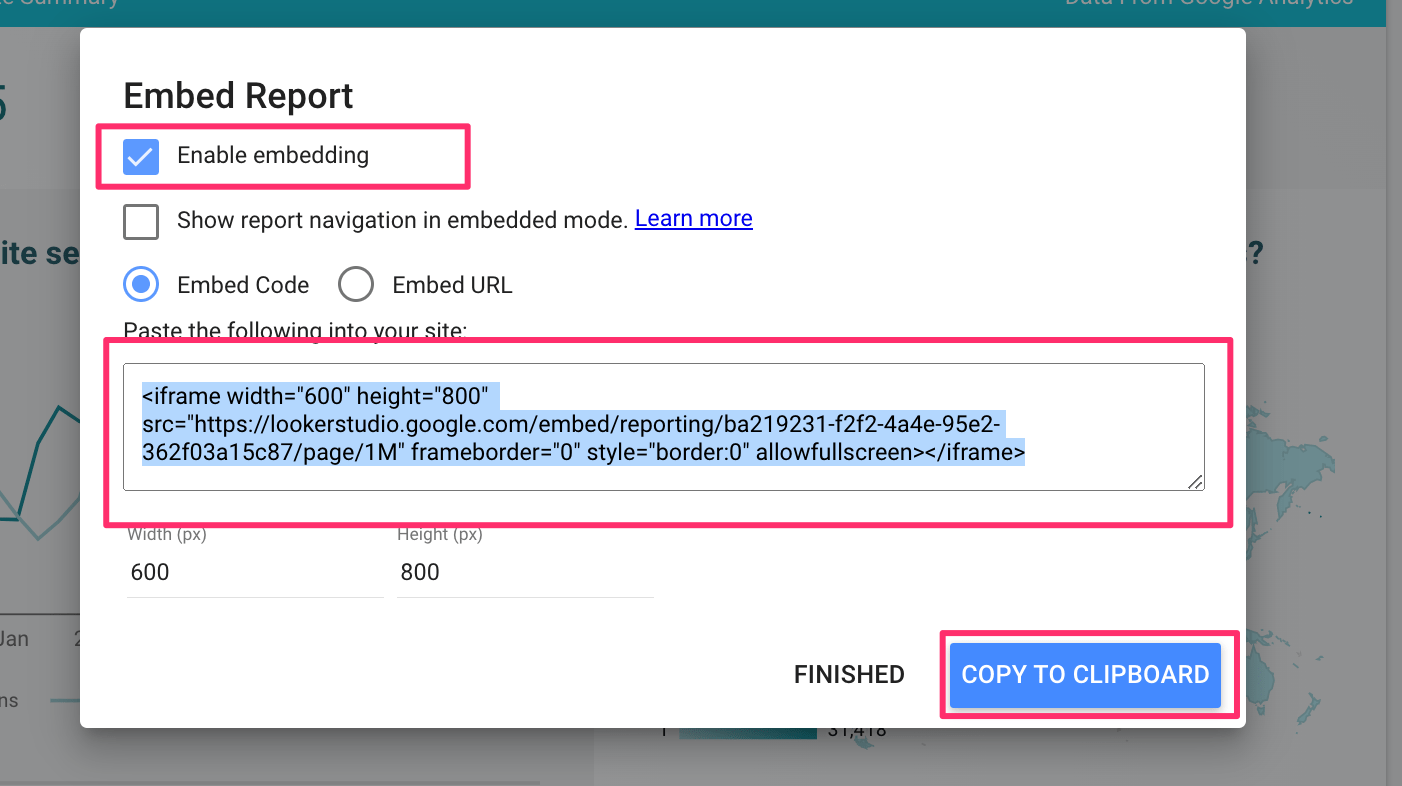
Ensure that Enable embedding is checked and copy the embed code. You’ll need this later.
Create the dashboard
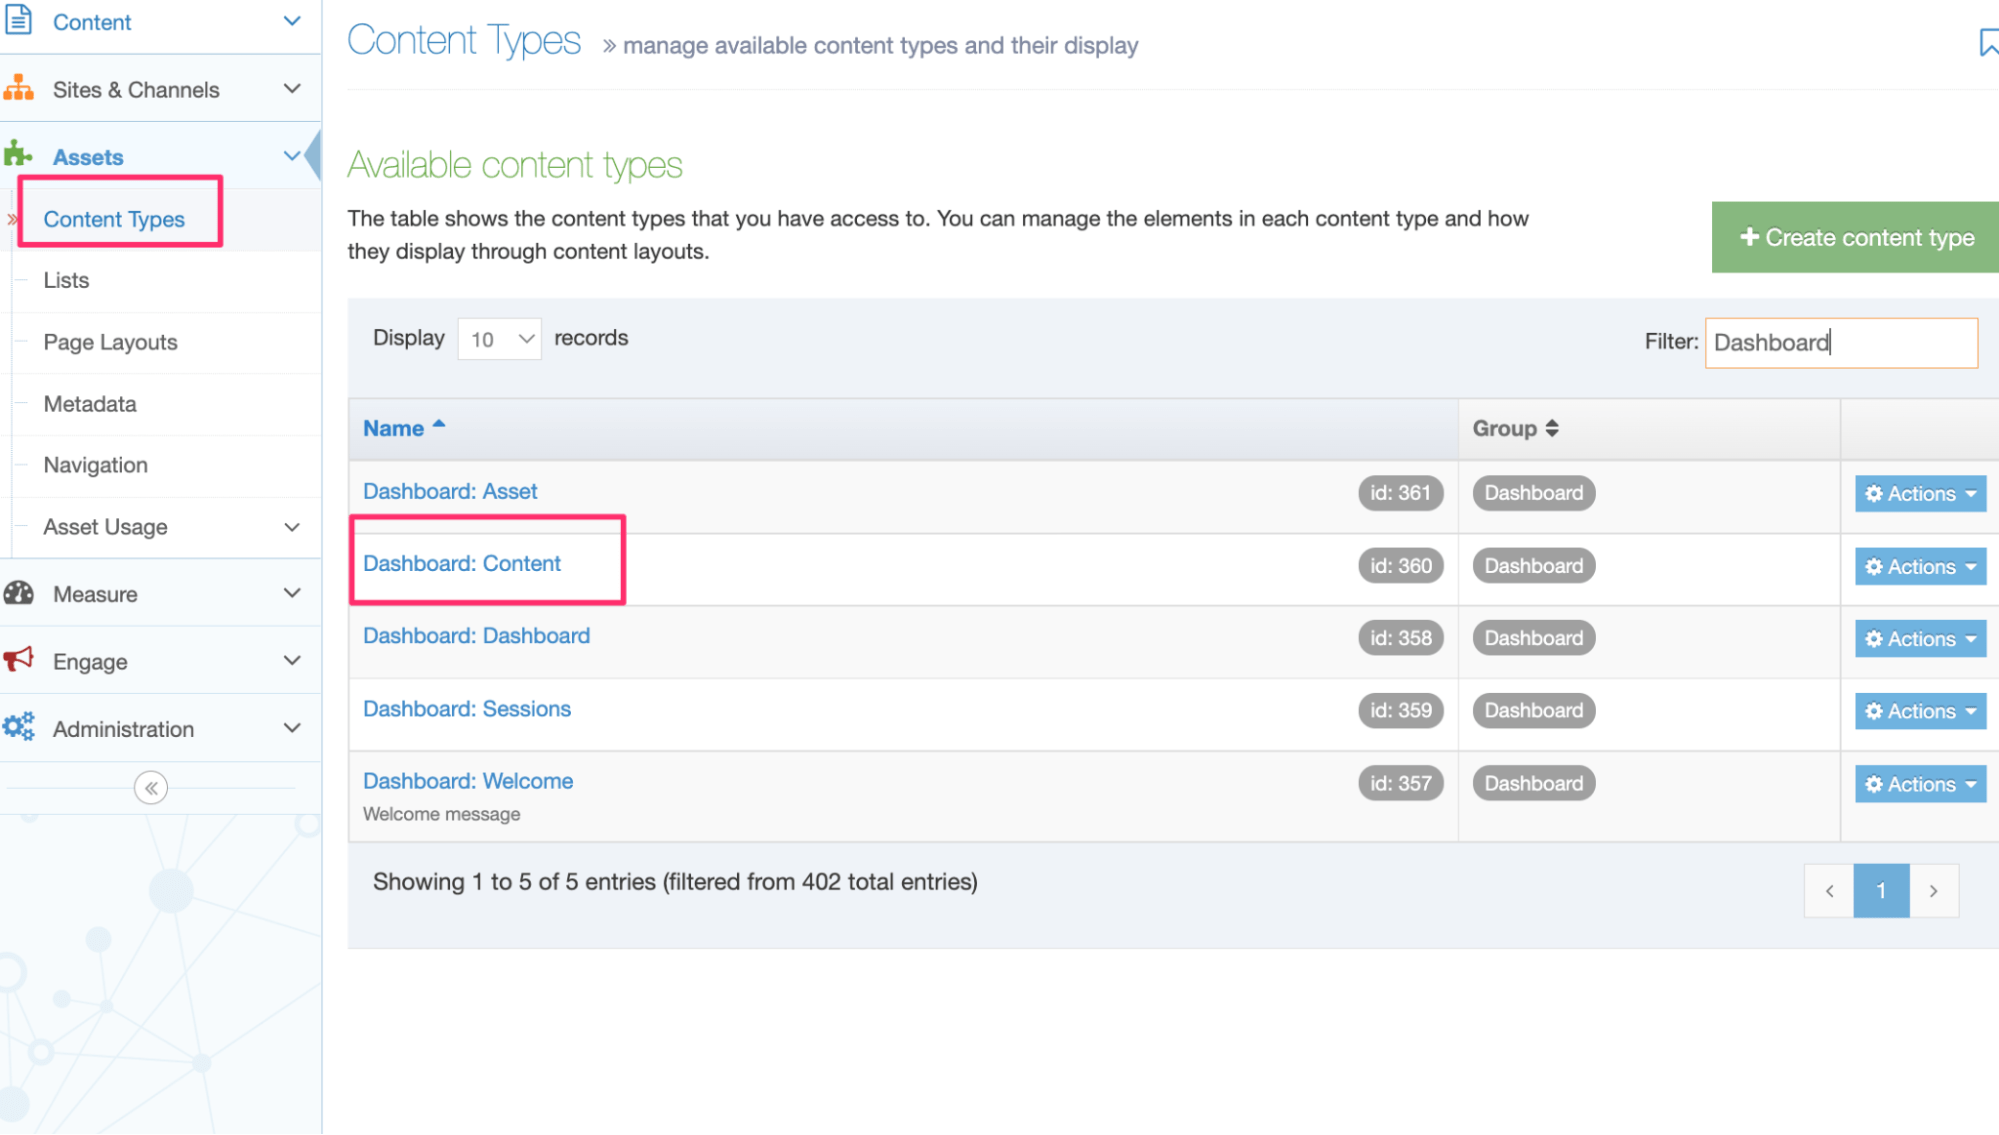
When the Dashboard is installed, a number of Content Types are installed with it. Search for “Dashboard: Content”:
In this Content Type, create an element that we’ll use to add the Google Analytics iFrame code to:
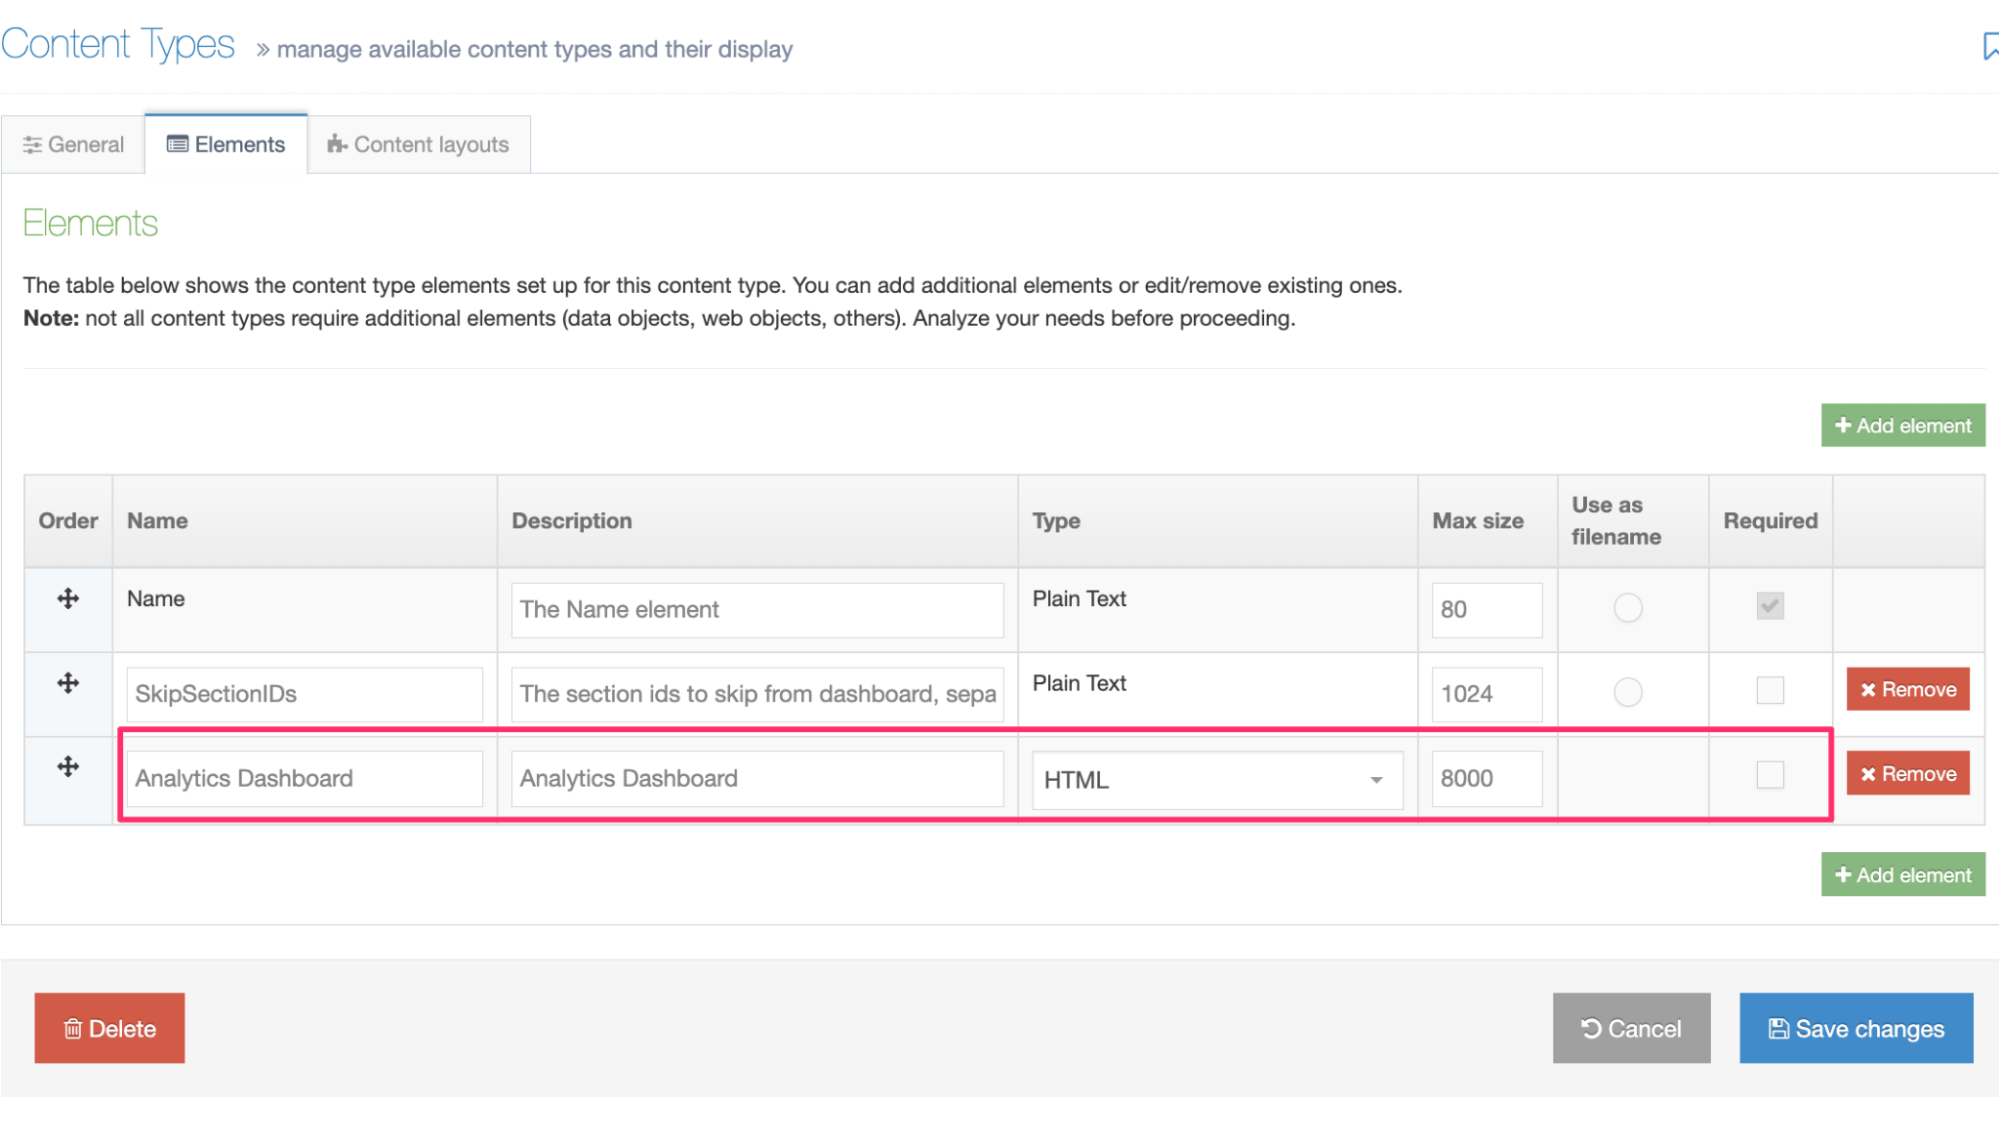
In the example above, I’ve given the HTML element a max size of 8000 and ensured that the field is not required.
Save your changes.
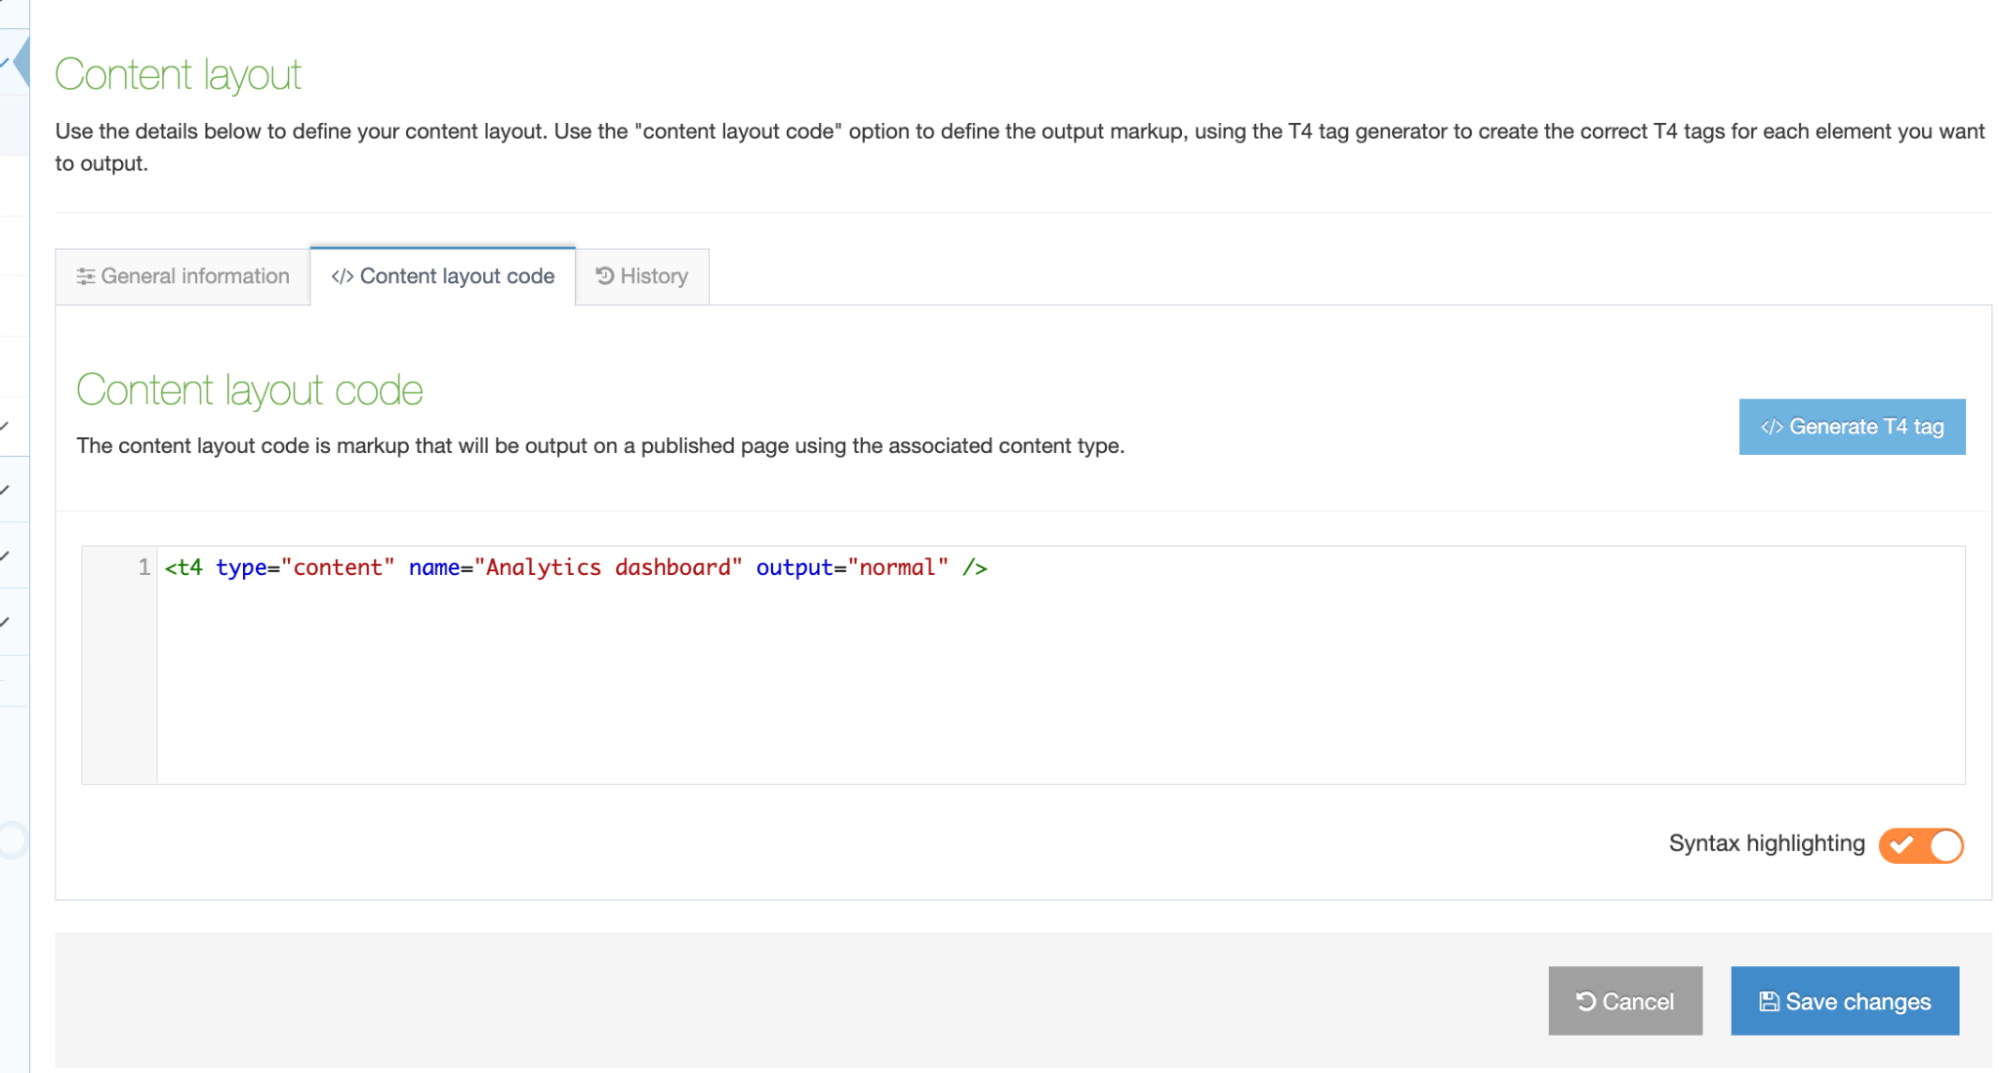
Add a new Content Layout named “text/analytics” to the “Dashboard: Content” Content Type. This will output the content of the element we just created.
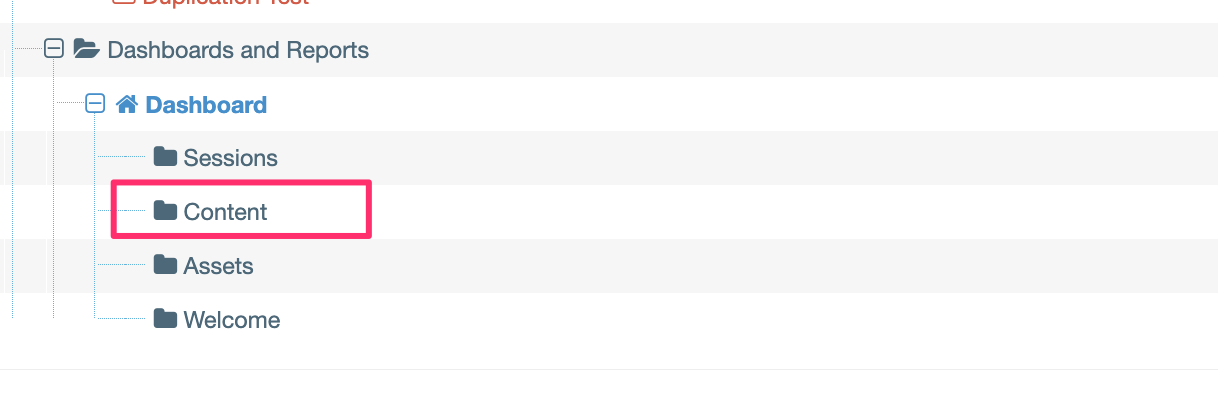
Go to the “Content” Section in the Dashboard:
Open the “Content Information” Content Item:
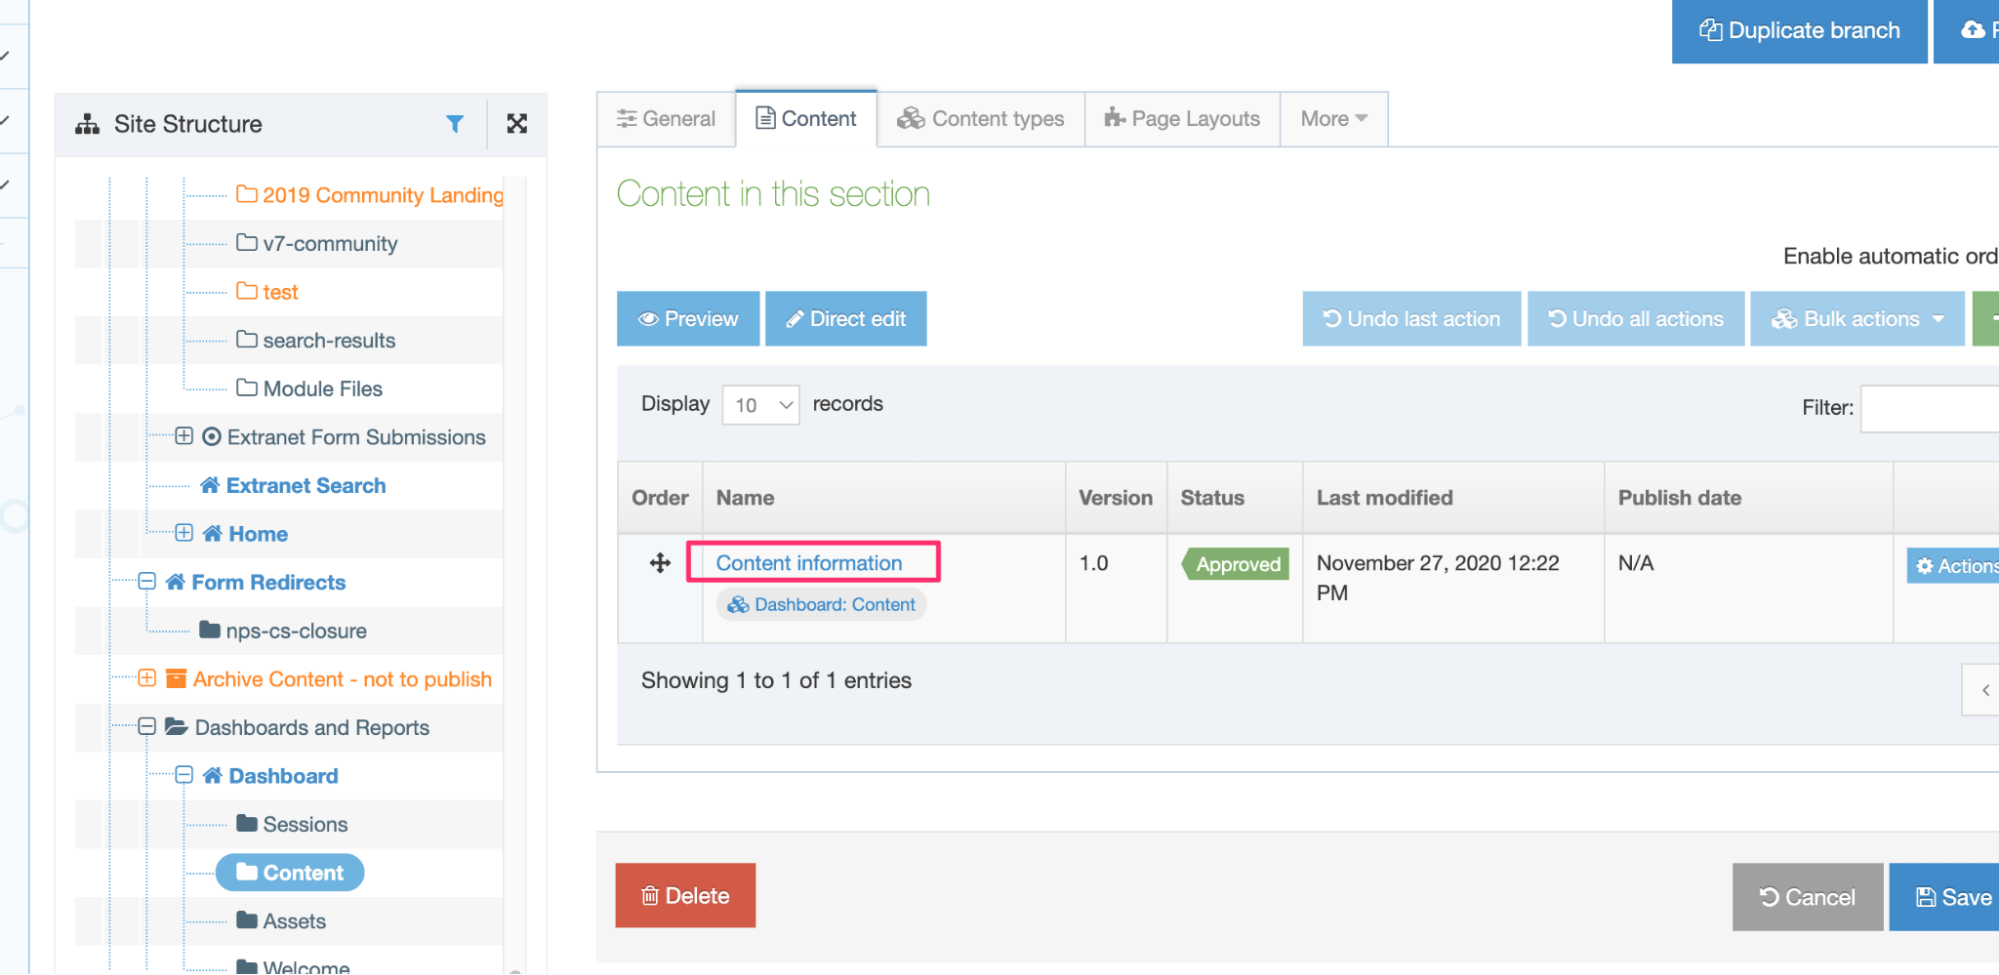
In the “Analytics Dashboard” HTML Editor, select View > Source:
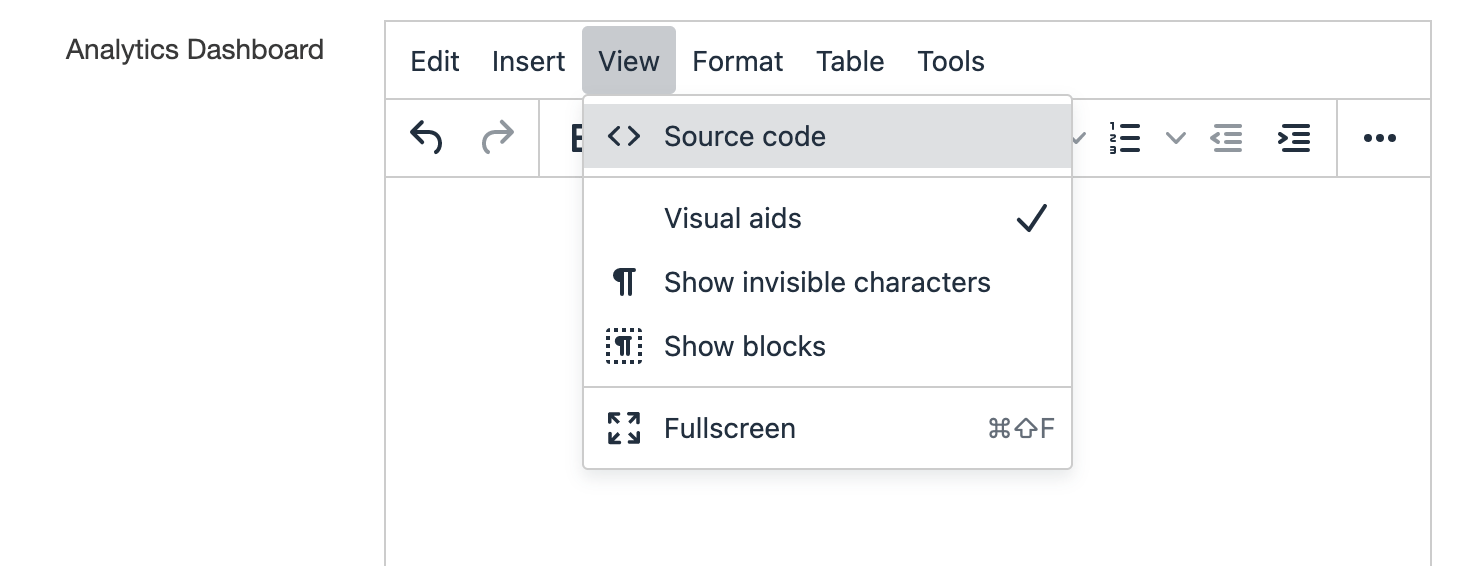
Paste the Google Looker Studio iFrame code and hit Save.
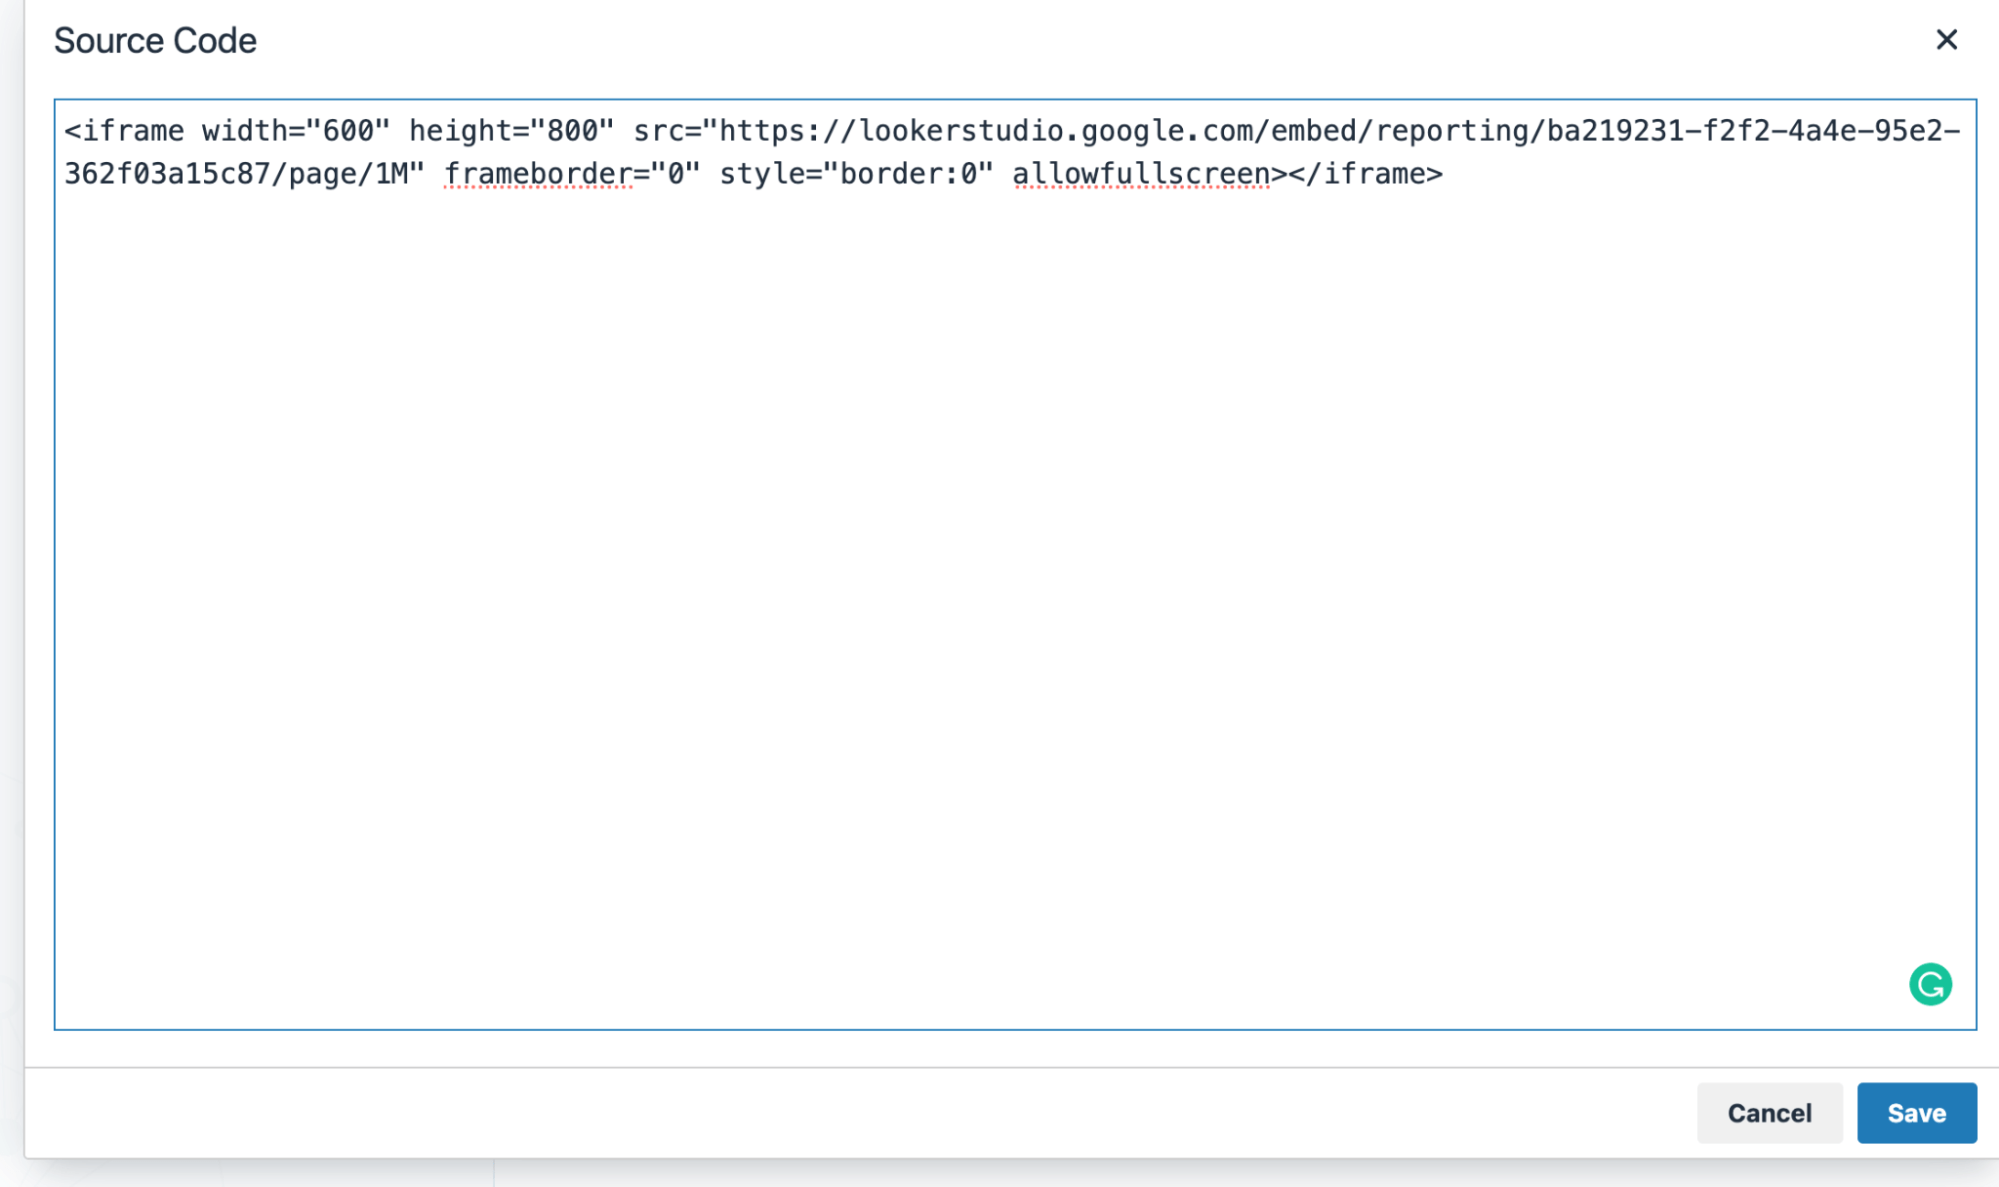
You’ll see the report in the HTML Editor:
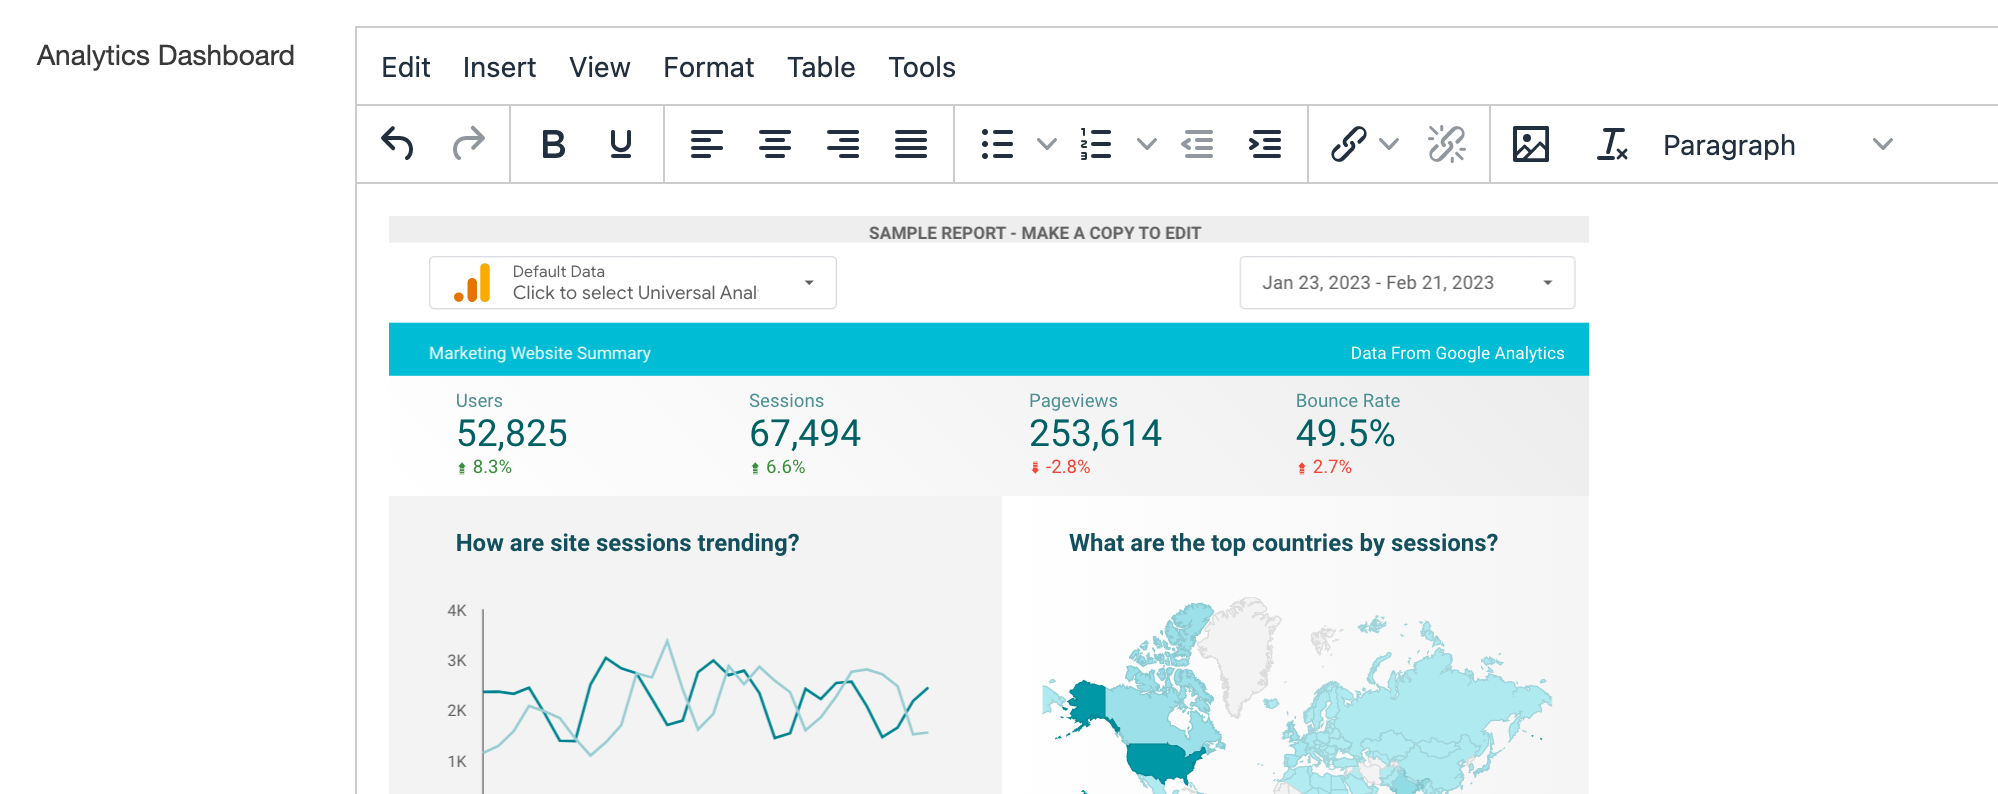
If you don’t see it, you should check that iFrames are permitted in your HTML Editor.
Save the Content Item. You might notice that the graph doesn’t display when you preview. We have one final step.
Back to the Dashboard
Go to Assets > Content Types and look for the “Dashboard:Dashboard” Content Type:
Add the tab
Open the Content Layout (there’s only one – text/html) and add the following:
  if(hasPermission(userLevel,40,40)) {
      document.write('    <div id="analyticsTab" class="tab-pane fade">\n');
    document.write('        <div class="welcome-dashboard">\n');
      document.write('            <div id="analytics">\n');
      document.write('                <div class="loading text-center"><div class="space-32"></div><br><div class="space-32"></div><i class="fa fa-spinner fa-2x fa-pulse"></i><br>Please wait</div>\n');
      document.write('            </div>\n');
      document.write('        </div>\n');
      document.write('    </div>\n'); }
to this part of the Content Layout:
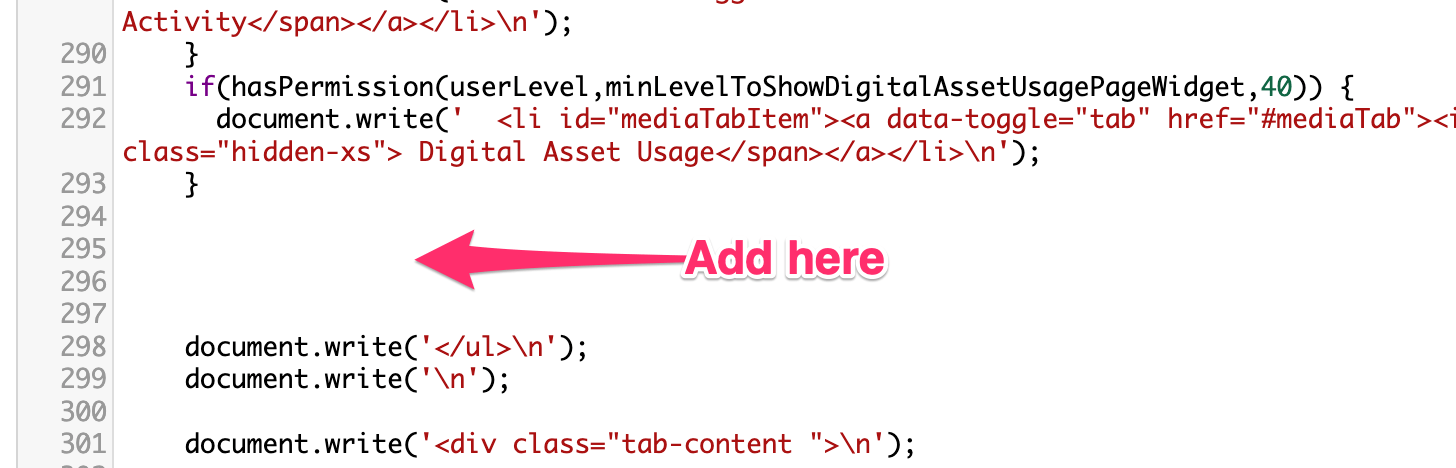
Add the tab label
 if(hasPermission(userLevel,40,40)) {
      document.write('  <li id="analyticsTabItem"><a data-toggle="tab" href="#analyticsTab"><i class="fa fa-bar-chart" aria-hidden="true"></i><span class="hidden-xs"> Analytics</span></a></li>\n');
    }
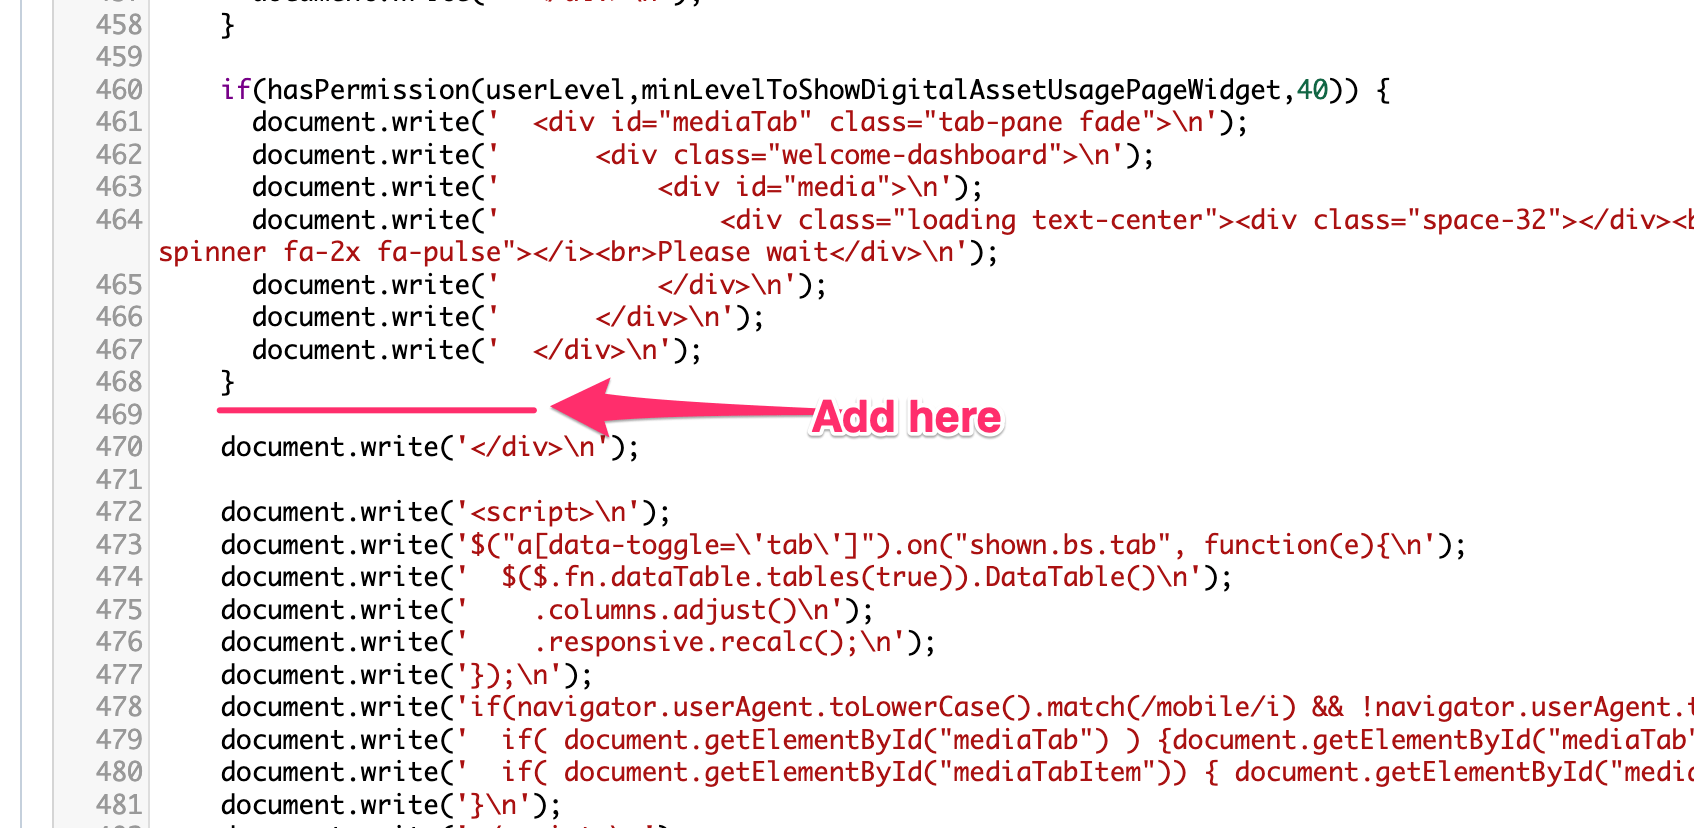
Add the Content Layout
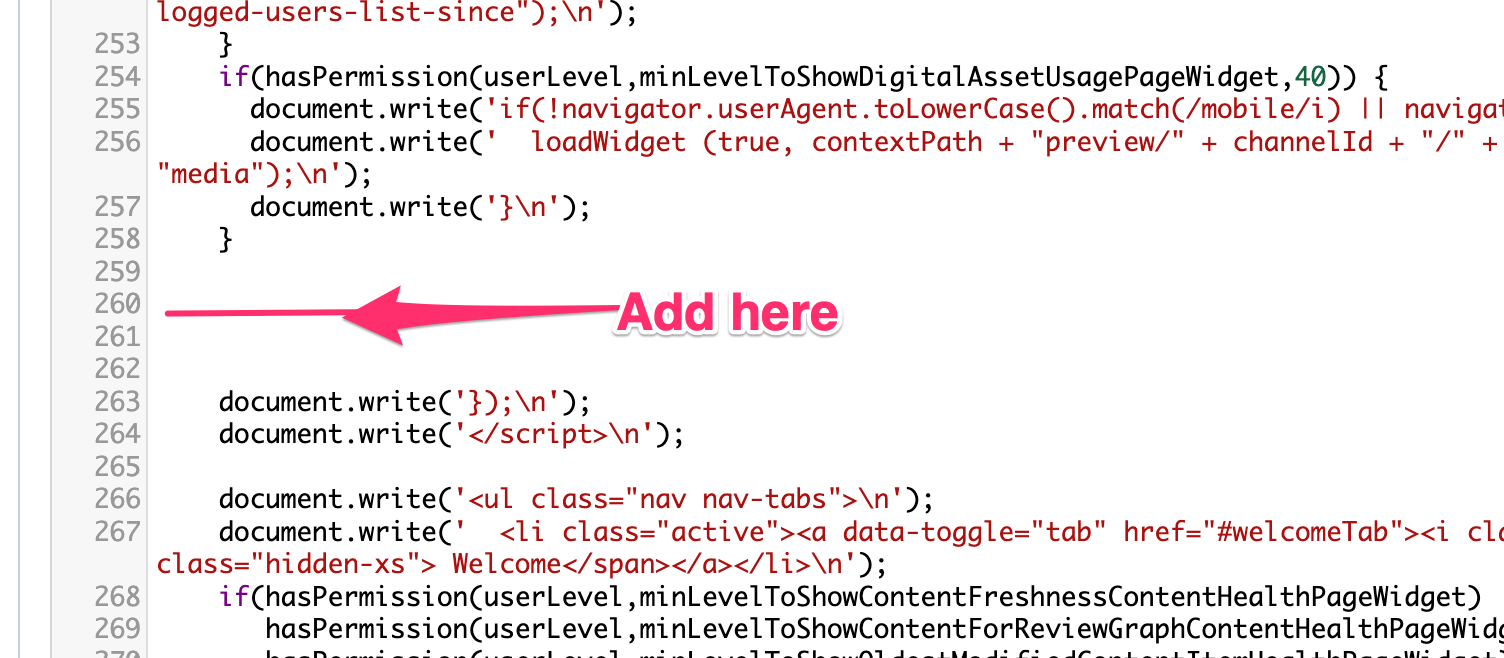
Once we have the new tab to hold the iFrame, we add the code to request the text/analytics Content Layout:
if(hasPermission(userLevel,40,40)) {
      document.write('loadWidget (true, contextPath + "preview/" + channelId + "/" + language + contentPath + "/text/analytics", "analytics");\n');
    }
to here:
Now return to the Dashboard to check out your interactive analytics report in the new Analytics tab:
Back to top