Google Analytics Dashboards
Description
Google Analytics Dashboards has been removed from the product in 8.3.16. Google Analytics charts will still be viewable in Direct Edit or can Google Analytics Reports be embedded within the Terminalfour Dashboard.
In Terminalfour you can use Google Analytics to learn about the traffic to your site as well as conversion rates, sources of traffic and bounce rates. This allows you to measure and analyze your content's impact to improve your site's effectiveness.
The Analytics Dashboards are context-specific, and the reports are based on "Views" from Google Analytics. All configuration is handled by Terminalfour administrators. Group rights are used to determine who can view the various dashboards.
There are four main steps when creating Dashboards:
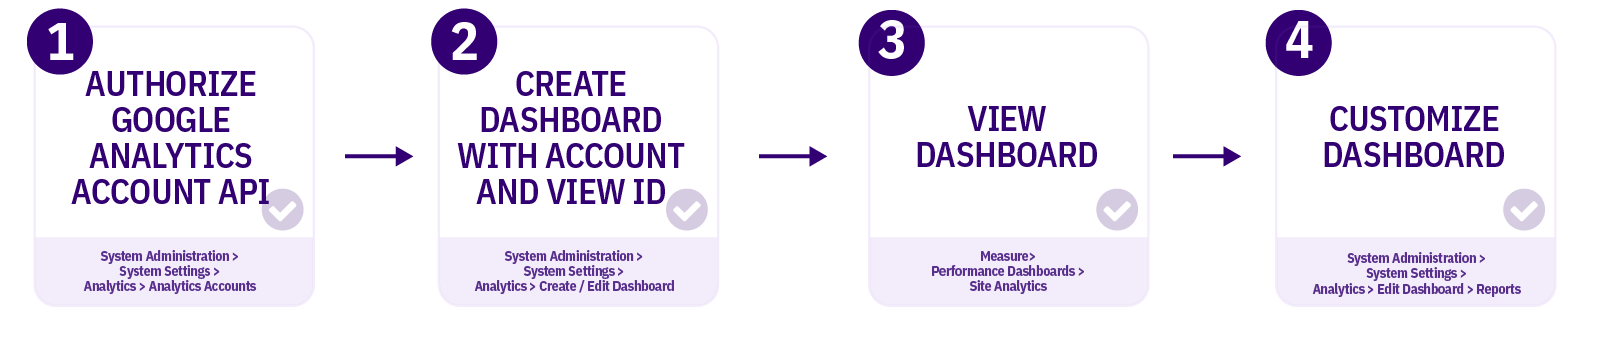
Authorize Google Analytics Account API
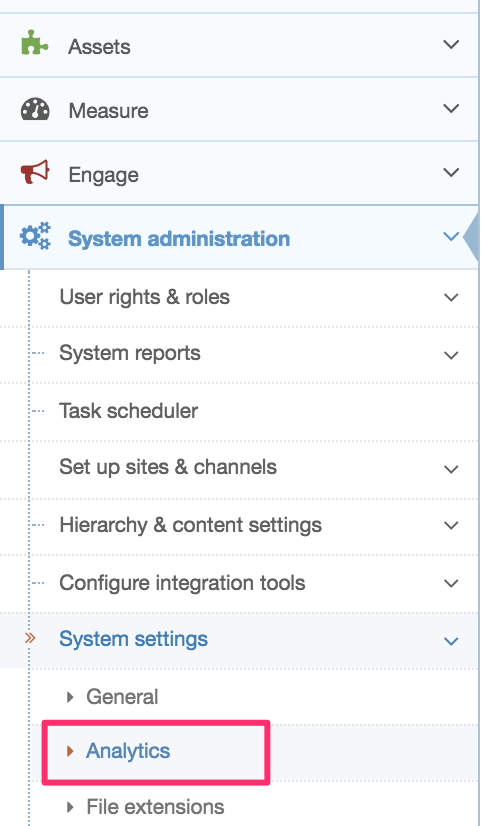
First, go to System Administration > System Settings > Analytics:
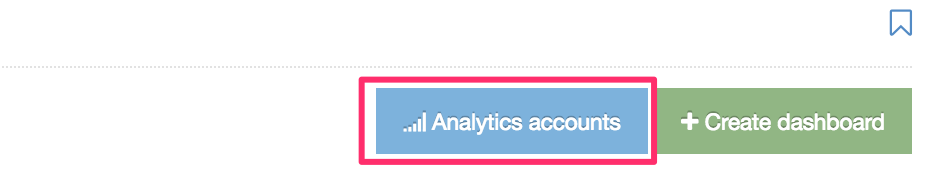
If you haven’t already linked a Google Analytics account to Terminalfour, select Analytics Account:
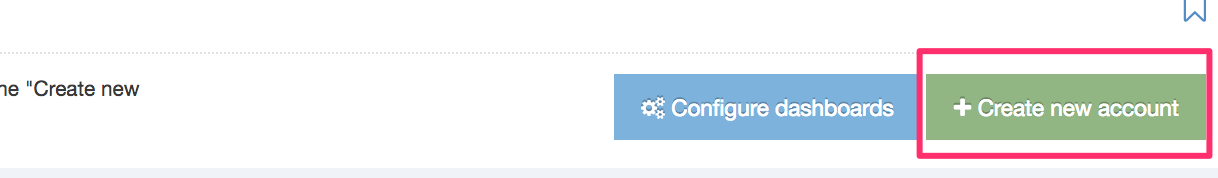
From the next screen, select Create New Account:
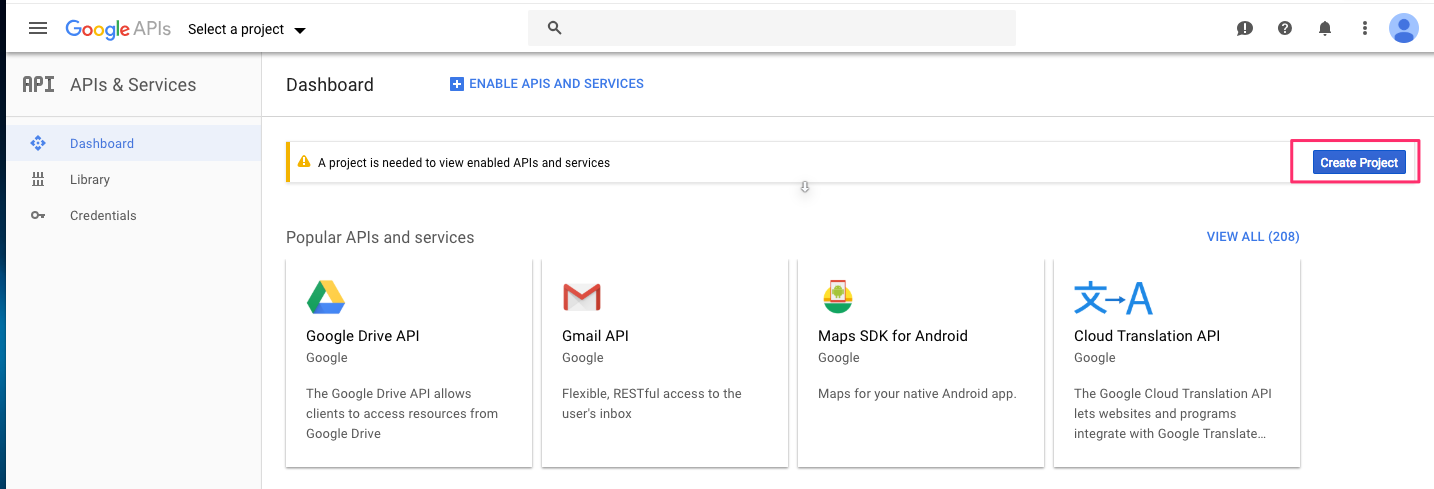
You'll need the Google API details to authenticate the account. Go to the Google API Console and create a new project specifically to use the Analytics API with Terminalfour:
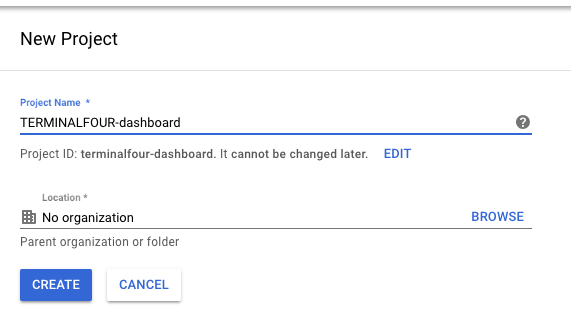
Give your project a meaningful name that you can recognize (this is especially important if you have more than one Project):
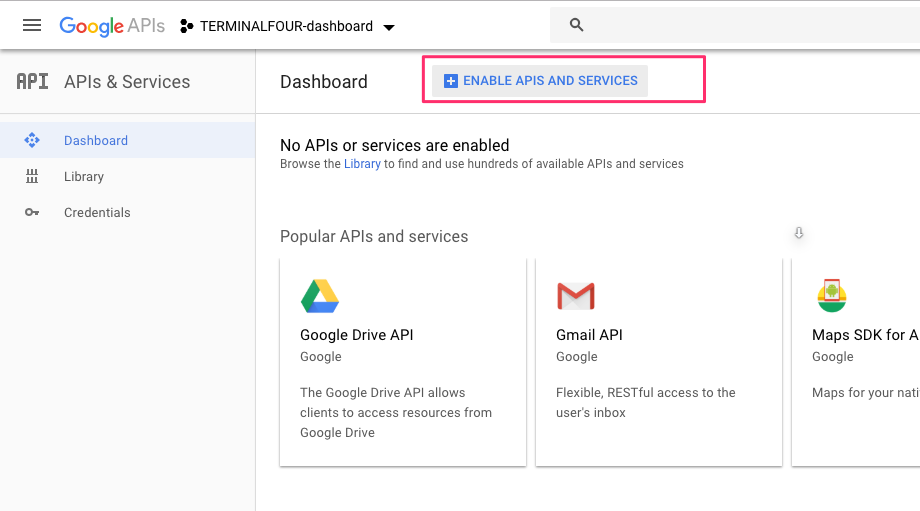
When you've created the Project, select Enable APIs and Services:
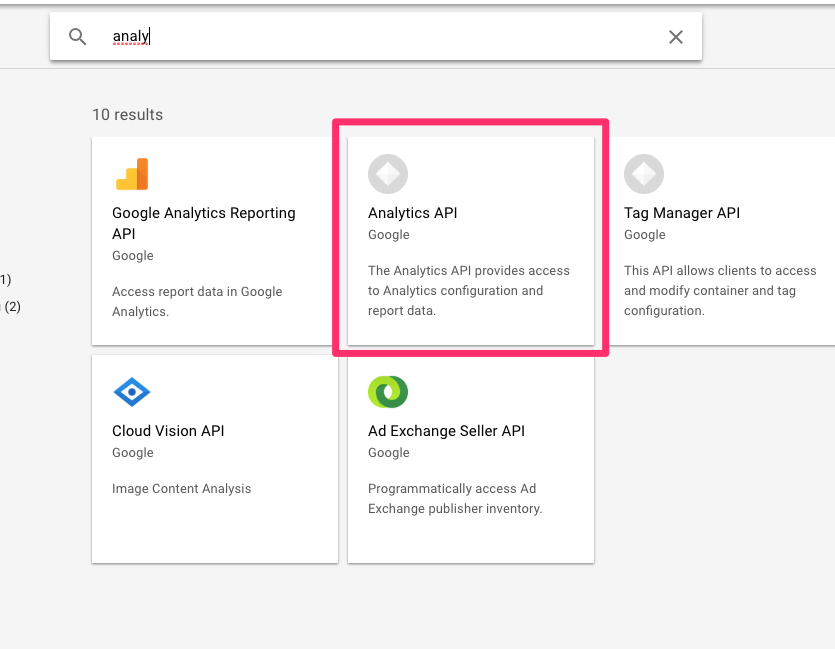
Searching for analytics will return some results. Select Analytics API (not the Google Analytics Reporting API):
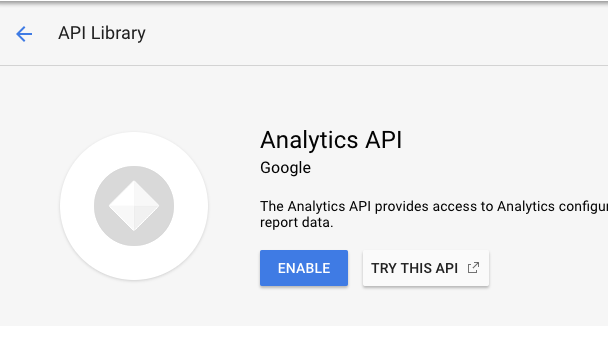
Select Enable:
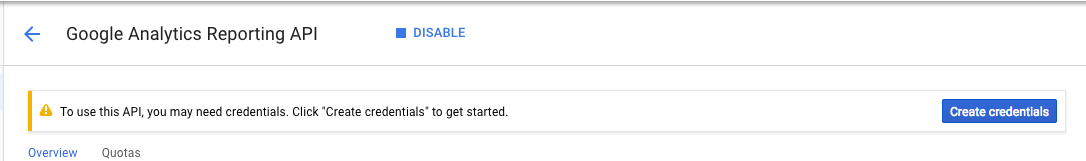
To get started with the API you’ll have to Create Credentials to use with it:
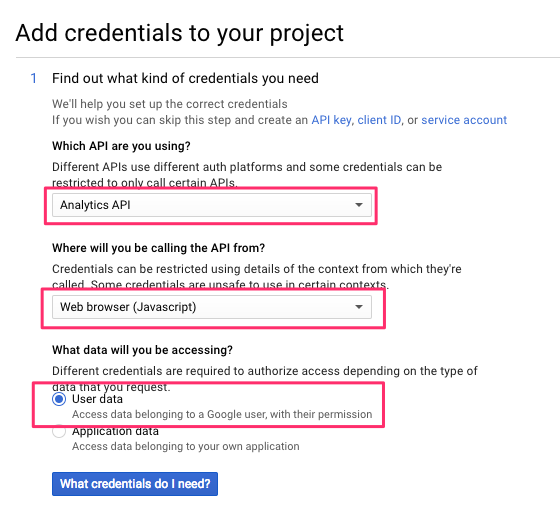
Next up, you’ll need to specify how you will be calling the API and the type of data you intend to access:
Next, you’ll be creating an OAuth2 Client ID to authorize the use of API with URLs from your Terminalfour instance:
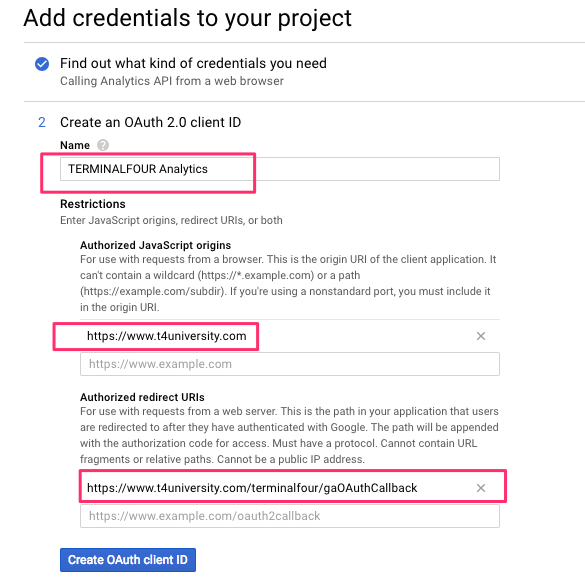
Here are some suggestions of what you could add here:
| Name | Description |
|---|---|
| Name | The name of the Client ID |
| Authorized Javascript Origins |
The Base URL for your Terminalfour instance. This is the IP address or hostname where API requests originate. Usually, this is the Terminalfour Application server IP address or hostname. e.g., if you log into Terminalfour at https://www.t4university.com/terminalfour/login.jspthen enter https://www.t4university.com into this field |
| Authorized redirect URIs |
Just copy the Redirect URL from the Create Site Analytics screen in Terminalfour. This is the location your browser will be redirected to when authorization is successful. The authorization information will be passed to this location and saved on the Terminalfour Application server; this is usually the Terminalfour context_url found in General Settings with gaOAuthCallback appended to it (case sensitive). Google Analytics requires an absolute URL so your Redirect URL cannot be relative.
|
In the next step, select add the Product name. Your mail should already be filled in:
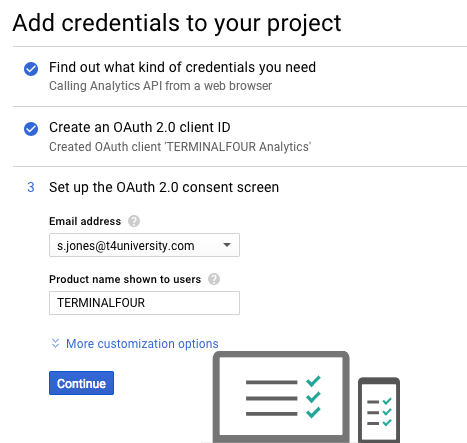
Select Done.
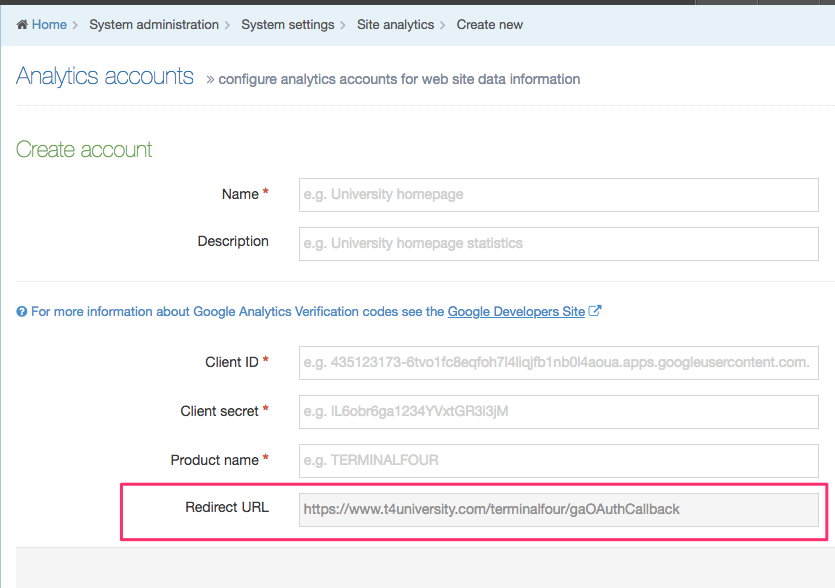
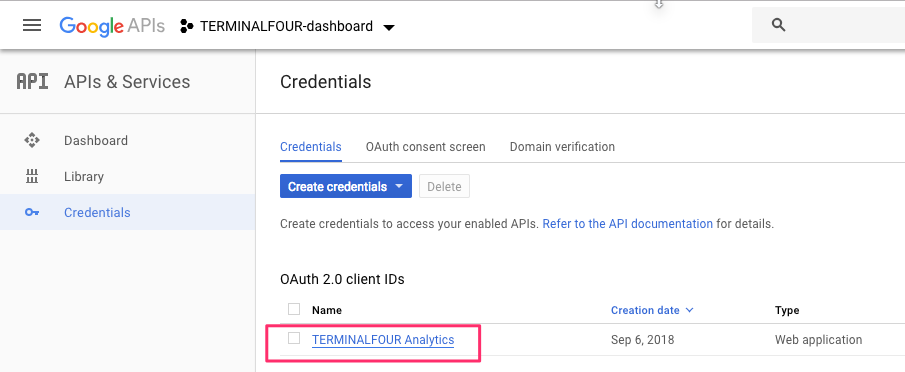
Once you've created the credentials are created, you can select its name from the list that appears:
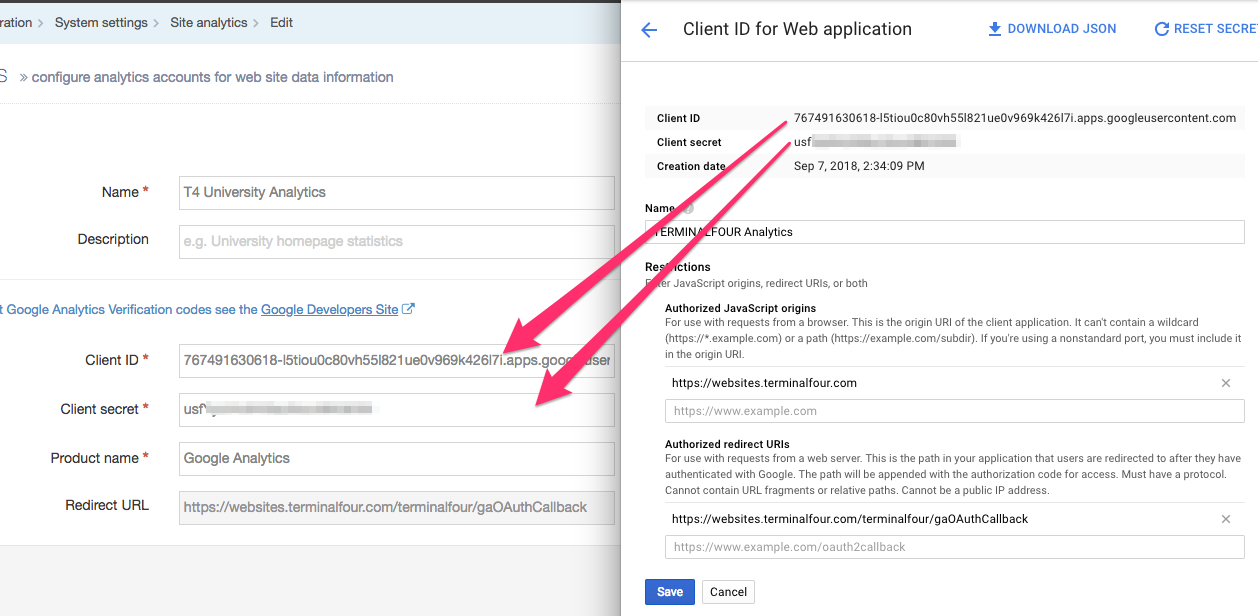
From the next screen, you’ll see the Client ID and Client Secret that you will require to complete the analytics account set up.
Just copy and paste both into the input boxes in Terminalfour:
Make the account and product names recognizable to you and others in your organization.
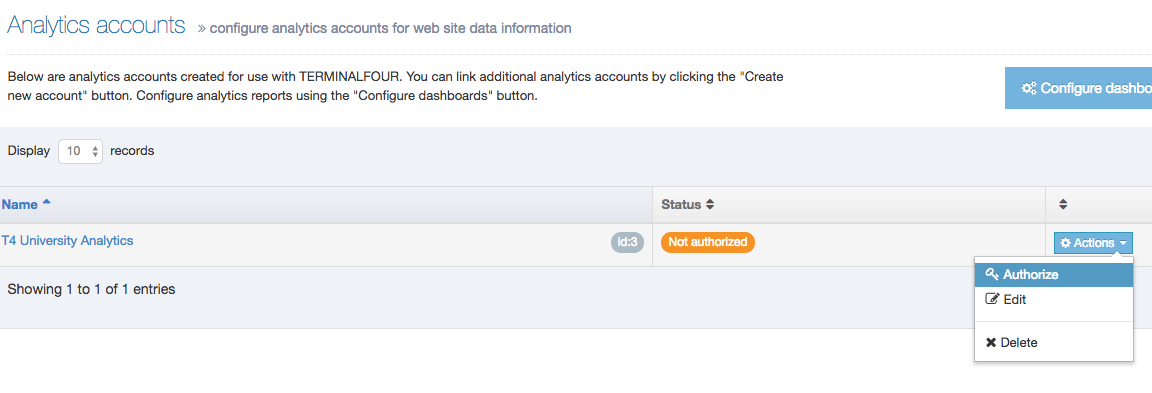
After you’ve saved your changes, you will have to authorize the account. Just select the Actions menu and choose Authorize:
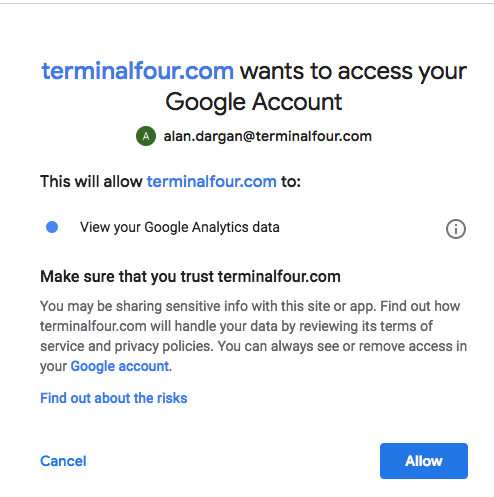
Then, select Allow from the pop-up that will appear. The requesting domain will differ from the one here:
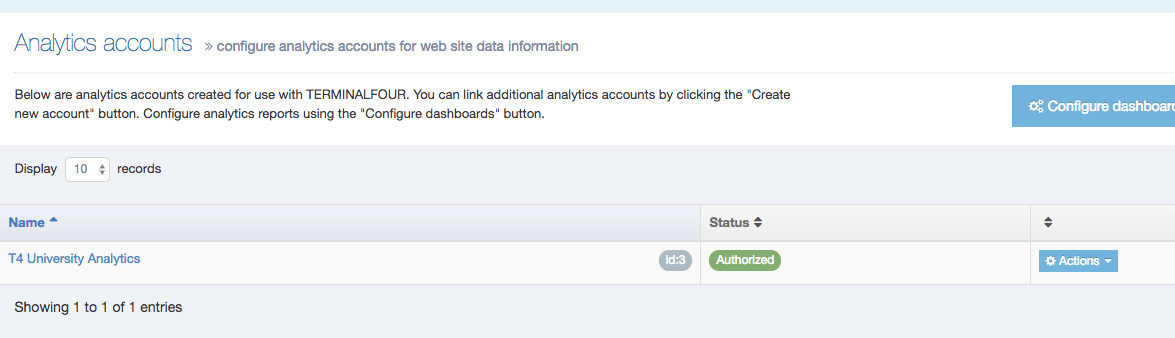
When authorized, the status will be updated:
Now that your account is set up, it’s time to set up your Dashboards.
Each Terminalfour instance comes with a sample Dashboard. In this example, we are going to use that as our starting point.
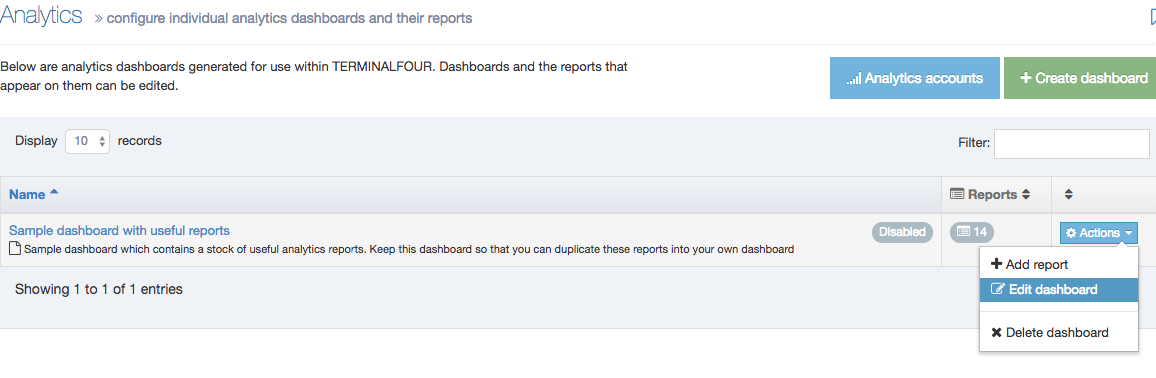
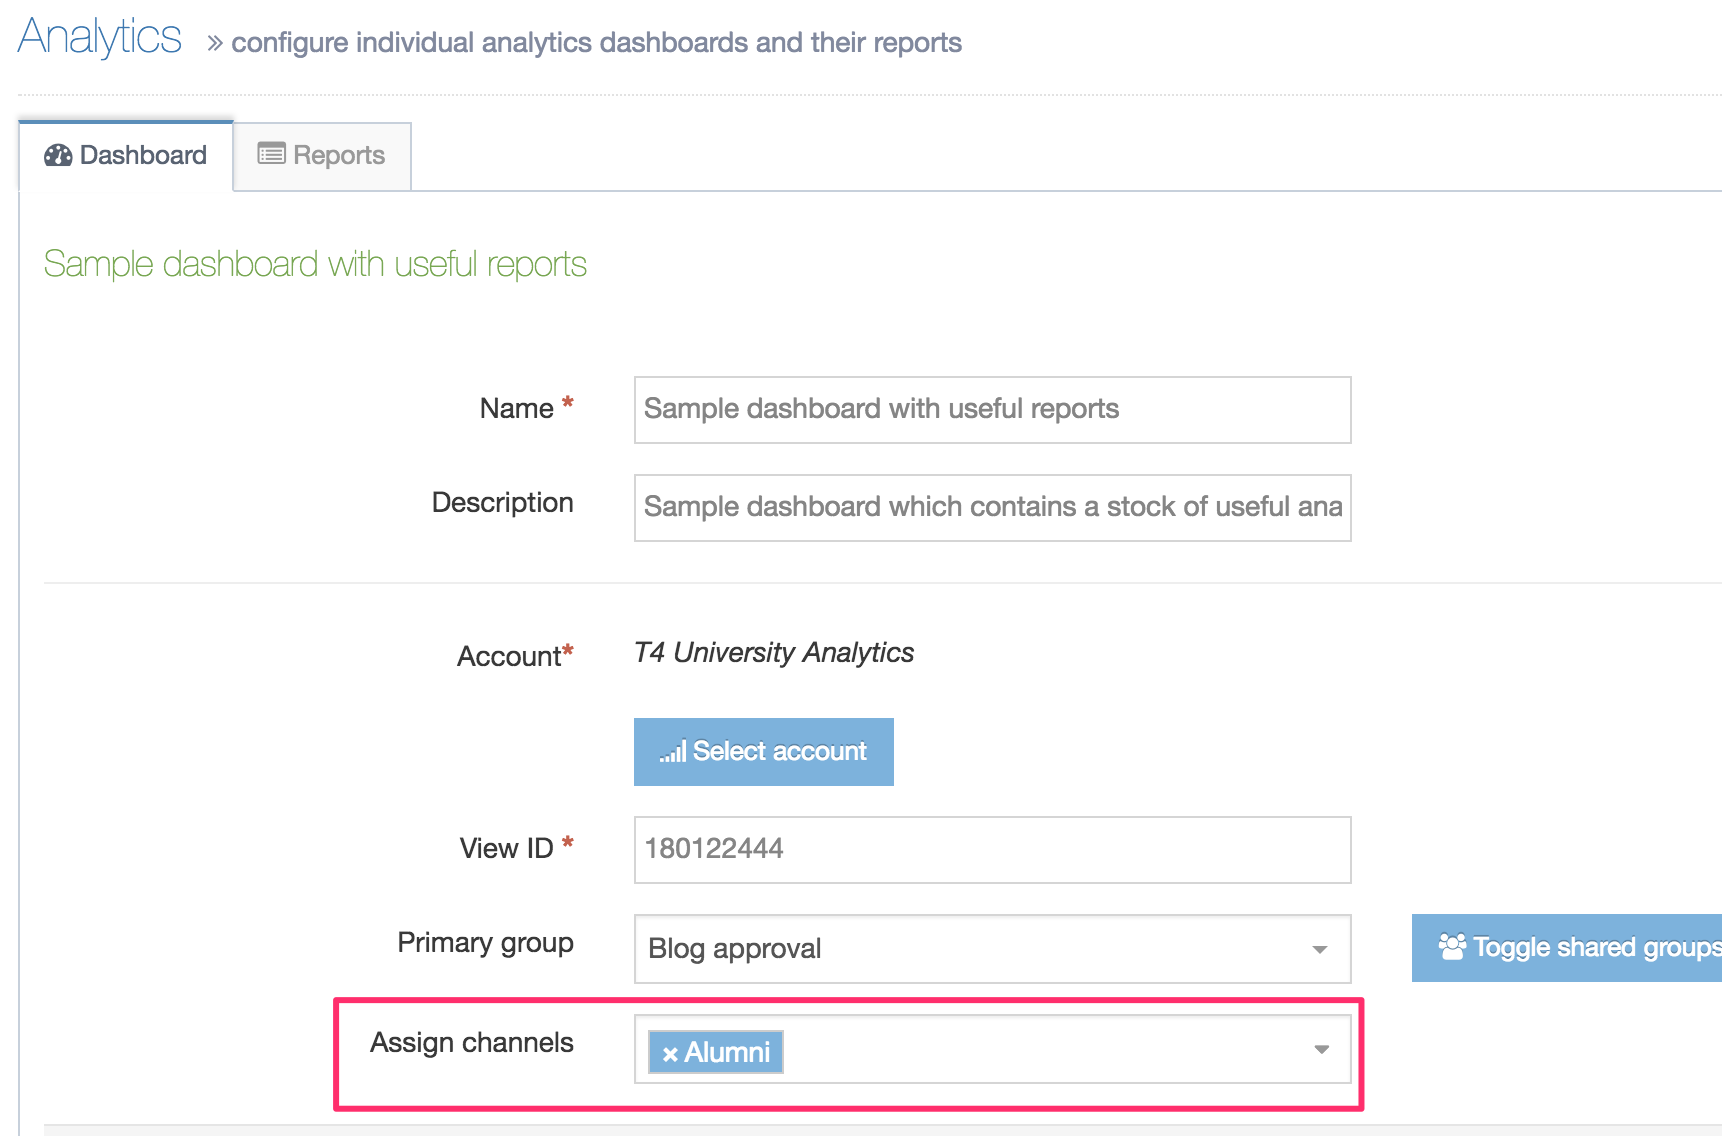
In System Administration > System Settings > Analytics you will see a list of existing Dashboards. If you haven’t created any others, the only one you’ll notice is ‘Sample dashboards with useful reports’. From the Actions menu select Edit Dashboard:
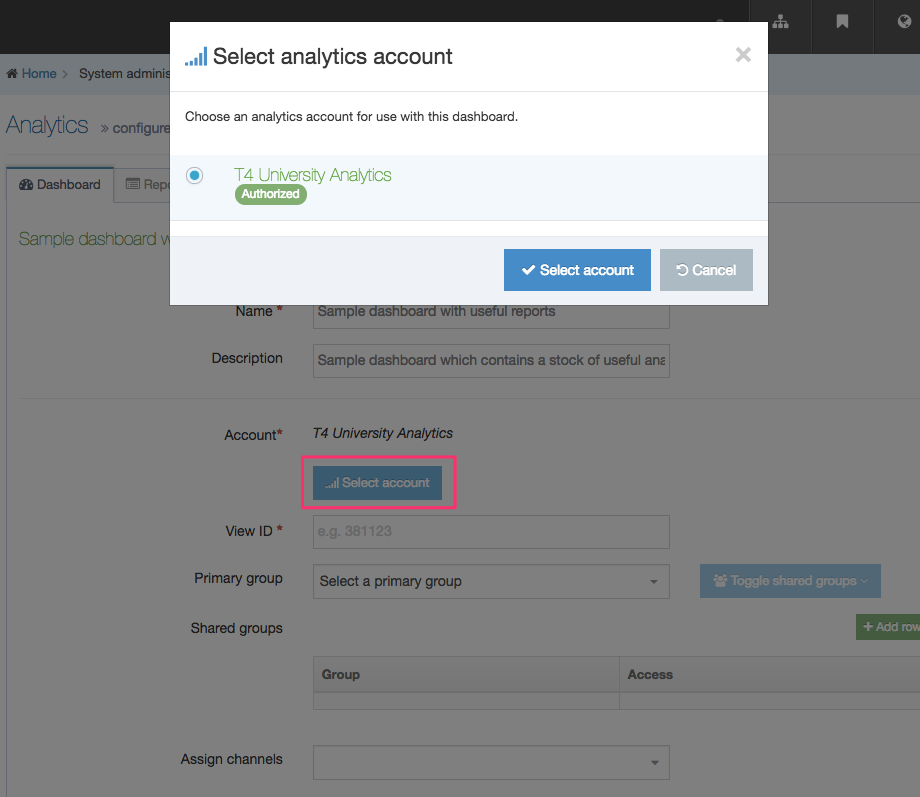
You’ll need to do a couple of things here. First up, link the Google Analytics account you’ve linked with your Terminalfour installation to the dashboard.
Click on Select Account and choose the analytics you’ve just set up:
Using the Dashboard
Create a Dashboard with Account and View ID
Next up, you are going to need the Google Analytics View ID. A ‘View’ is essentially the data from a particular site and while a View can be filtered, so it only includes some of the data, the default that Google Analytics creates is unfiltered. That’s the one we are going to use.
This article on how a Google Analytics account is organized will give you a little more detail on some of the terms, like Property and View, which are used in Google Analytics.
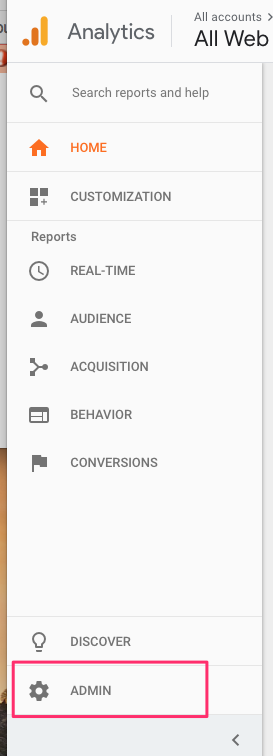
Go to Google Analytics. You should already be logged in with the same Google account that you used to set up the API and select Admin:
Make sure that you have the right Property (website to track) selected and select View Settings:
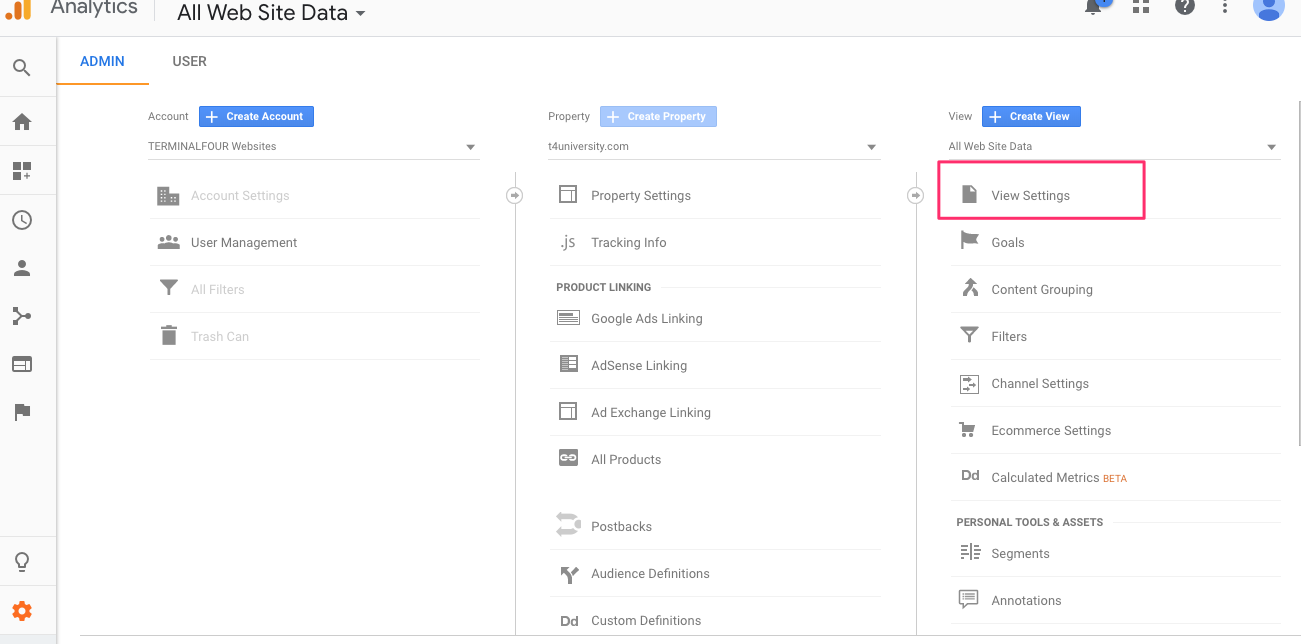
Copy the View ID:
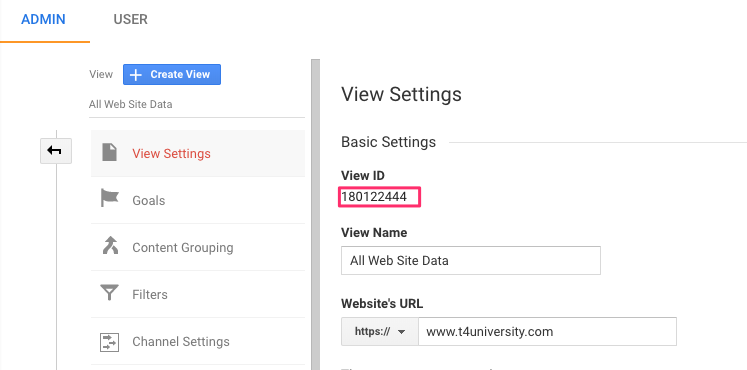
Paste it into the View ID box in the Analytics settings:
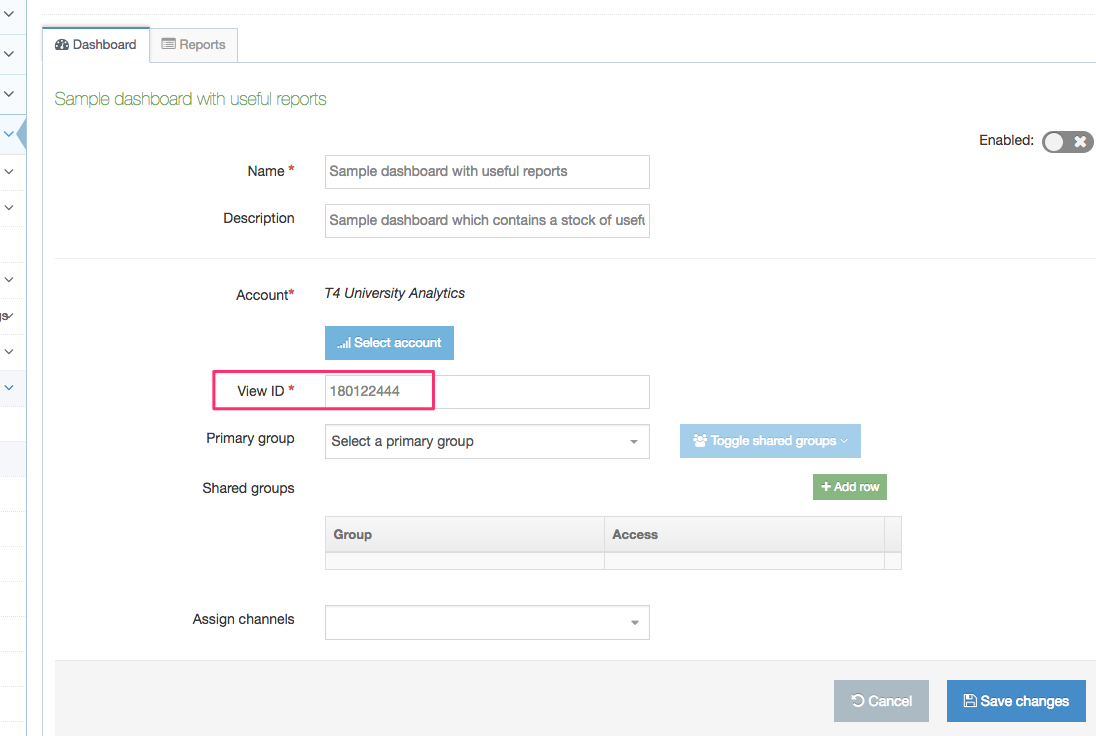
Enable the Dashboard and choose Save Changes:
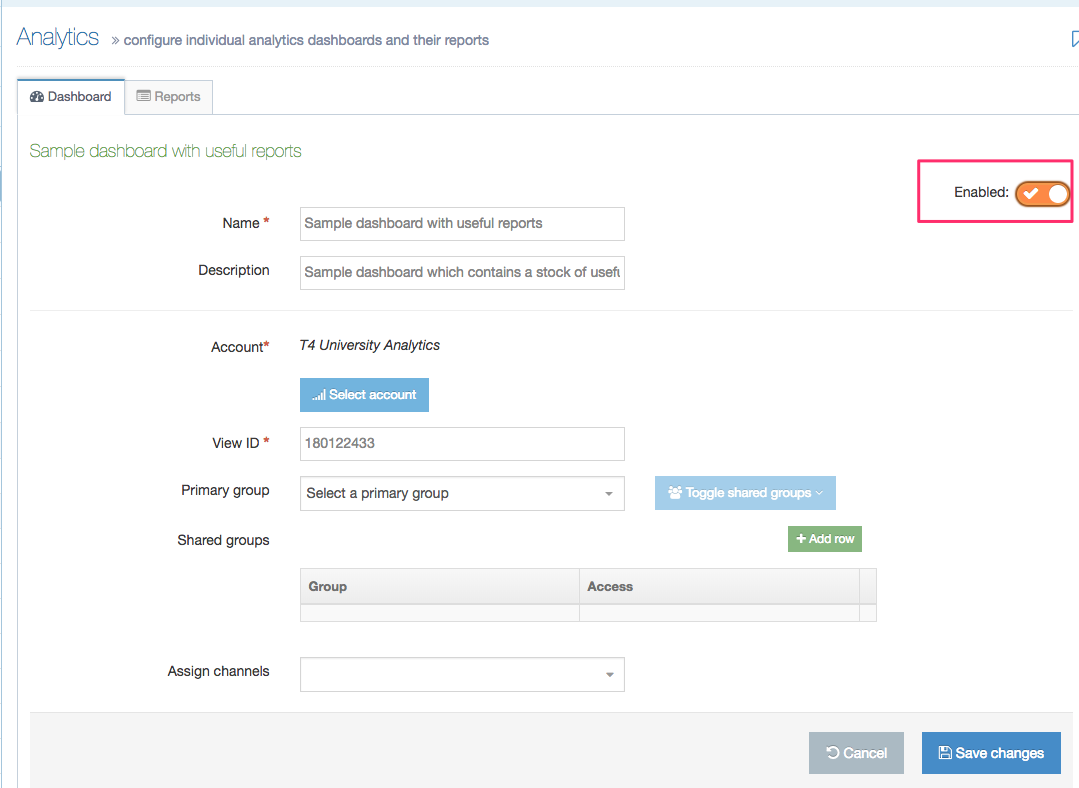
On this screen, you can also specify the Groups who can view the Dashboard.
View your Dashboard
To view your Dashboard go to Measure > Performance Dashboards > Site Analytics:
Customize Dashboard
You can change the order of Reports by clicking and dragging the Move icon from the Order column of each Report. Reports can be deleted and edited via the Actions menu on the right:
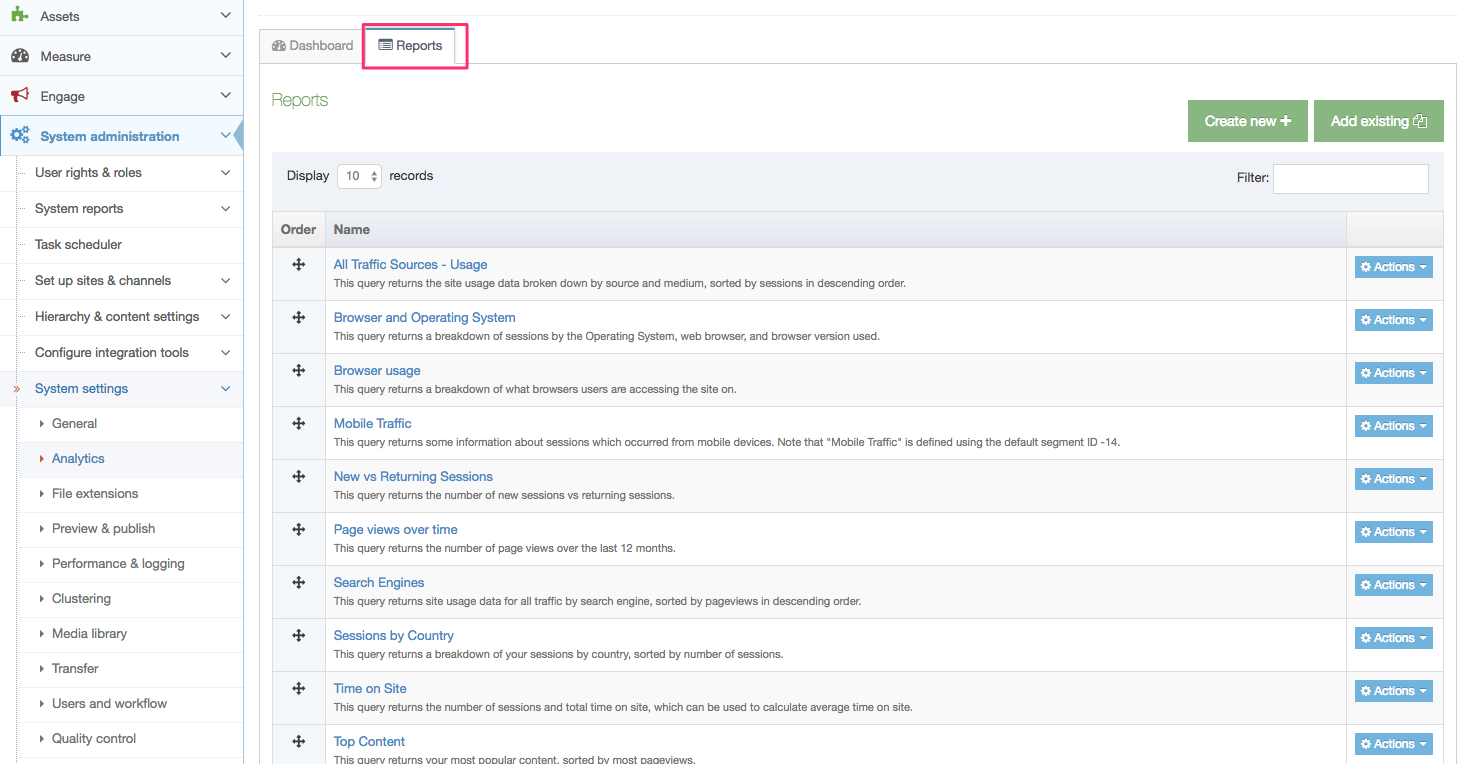
Each Report can be based on some or all of the following options:
A Query Explorer is available here so you can try out your queries beforehand.
| Item | Description |
|---|---|
| Widget Size |
Determines the size of the widget on the user's Dashboard.
|
| Dimensions |
Used to describe data. A dimension for a geographic location could have dimensions called Latitude, Longitude, or City Name. Values for the City Name dimension could be Boston, Dublin, or Sydney. To learn more about Dimension and Metrics have a look at Analytics Help. |
| Metrics |
Individual elements of a dimension that can be measured as a sum or a ratio. For example, the dimension City can be associated with a metric like Population, which would have a sum value of all the residents of the specific city. Screenviews, Page per Session and Average Session Duration are examples of metrics in Google Analytics. To learn more about Dimension and Metrics have a look at Analytics Help. |
| Segment |
Helps you to focus on specific elements of your traffic. As an example, you can focus on users from a particular country, from a specific campaign, who visit during a particular hour of the day, etc. More information on segments. |
| Filters |
Limits the data that is included in a view. For example, you can use filters to exclude traffic from particular IP addresses, focus on a specific subdomain or directory, or convert dynamic page URLs into readable text strings. Google Analytics supports two main kinds of filters: predefined and custom. For information on how to create filters, check the Google documentation. |
| Sort | The order and direction to retrieve the results. Can have multiple Dimensions and Metrics. Ascending: ga:visits Descending: -ga:visits |
| Date range | Select the fixed date range if you want to set a start date and end date. Alternatively, select the variable date range and set the interval |
| Start index | If your result set contains 50 values, you can opt to start the index at 20 to ignore the first 20 values. |
| Max results | Specify the maximum results to output |
| Results data | Choose to clean up labels returned from the analytics service. |
| Chart data |
Display returned data as a pie chart or line chart.
|
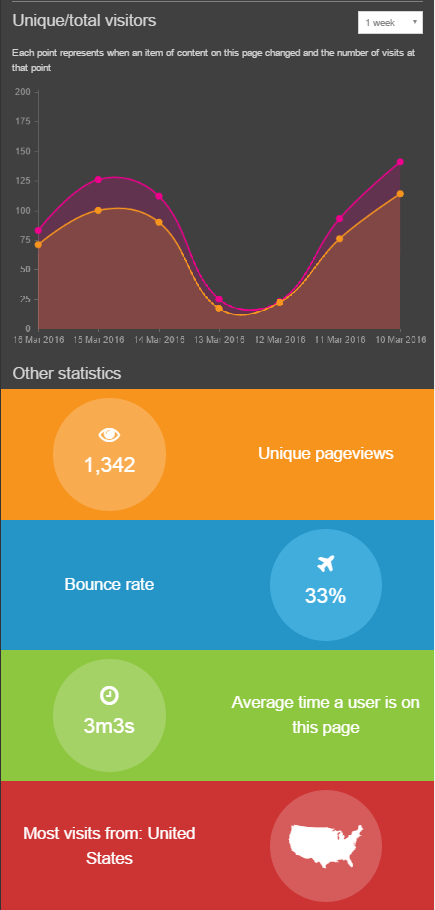
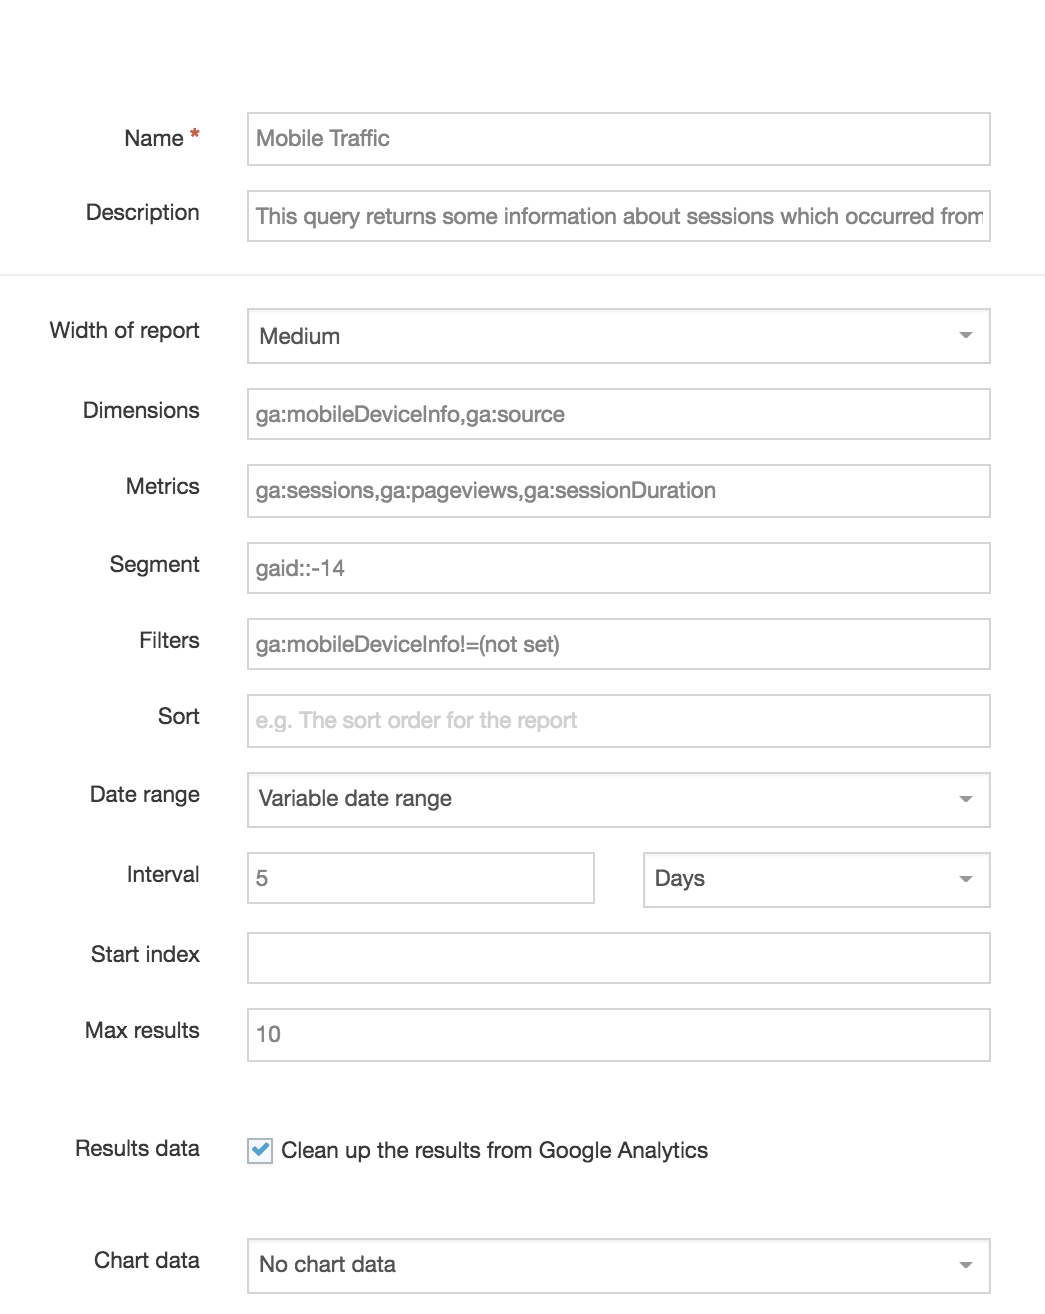
Sample Report
Below you can see a sample Report measuring mobile traffic to a site.
This query returns information about sessions which occurred from mobile devices. Note that "Mobile Traffic" is defined using the default segment ID -14:
Direct Edit Integration
Once a Dashboard is displaying correctly it can be associated with a Channel.
When the Dashboard is associated with a Channel, the analytics will display in Direct Edit. The results are based on the Section path and displays like so: