Publish reports
- Last Modified:
- 26 May 2020
- User Level:
- Power User
Description
Publish reports give information about each channels' publish performance. To access the Publish reports, go to System administration > System reports > Publish reports.
The level of reporting for each channel is configured in the Channel settings, under 'Publish options', and the duration for which publish reports are retained is configured in the Performance & Logging configuration.
Publish data
A listing of previous publishes is displayed. Currently, channel & microsite publishes are listed. In future, publishes for content, section and section branch publishes will be listed.
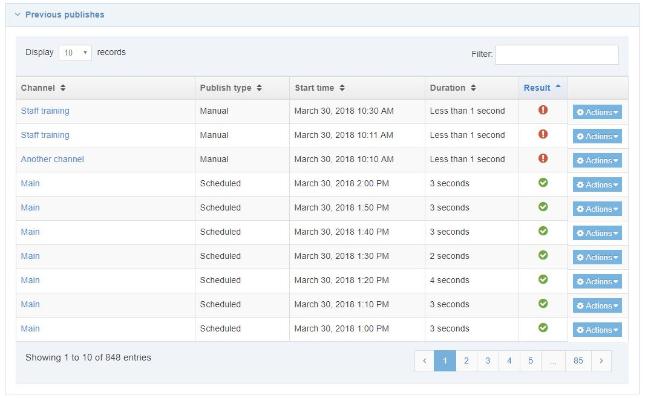
For each publish, the following is provided:
| Item | Description |
|---|---|
| Channel | Name of the channel published, links to publish details |
| Publish type | Scheduled or Manual |
| Start time | Date and time the publish started e.g. June 30, 2017 10:30 AM |
| Duration | Length of time the publish took e.g. 3 minutes, 5 seconds |
| Result | Introduced in 8.2.9. If the publish was successful, a green tick is displayed  or if the publish failed, then a red circle with an X in it, is shown or if the publish failed, then a red circle with an X in it, is shown  |
| Actions: View details | Link to view publish details |
| Actions: Download log | Link to download the log in a text file e.g. PublishReport-11-30_30_Jun_2017.txt |
| Actions: Download statistics | Link to download the statistics in a csv file e.g. PublishStatistics-11-20_30_Jun_2017.csv |
Publish reports of deleted Channels cannot be viewed.
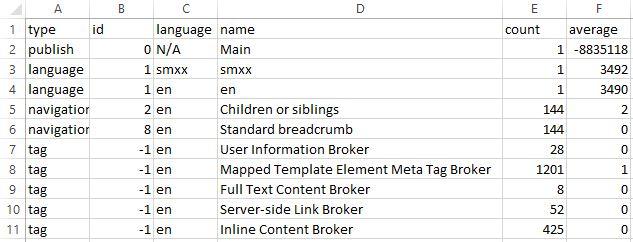
Example of the statistics file opened in excel
The "count" column shows the number of times that object is processed within the publish. The "average" column is the average number of milliseconds per instance of that object. Multiply the two columns together to get the approximate length (in milliseconds) that the individual object is adding to the publish duration.
Publish details
A summary is displayed for all publishes and details of sections, content, navigation objects and tag brokers is provided for some publishes.
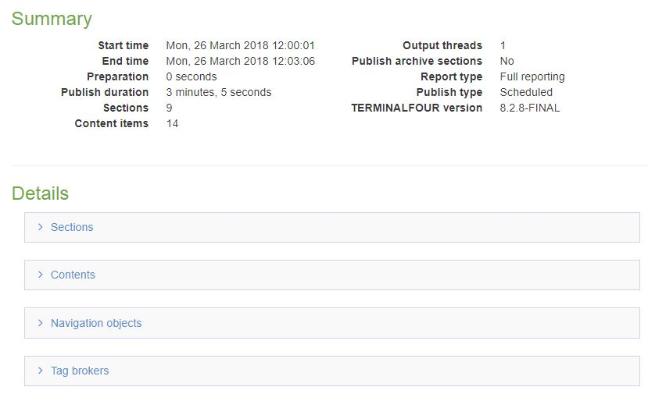
Summary
| Item | Description | Example |
|---|---|---|
| Start time | Date and time the publish started | Fri, 30 March 2018 11:30:42 |
| End time | Date and time the publish ended | Fri, 30 March 2018 11:30:46 |
| Preparation | Time it took to prepare the publish | 0 seconds |
| Publish duration | Time the publish took | 3 seconds |
| Sections | Total number of sections published | 142 |
| Content items | Total number of content items published | 236 |
| Output threads | Number of threads used during publish | 1 |
| Publish archive sections | Whether archive sections were published | No |
| Report type | Level of reporting | Full reporting |
| Publish type | Scheduled or Manual | Scheduled |
| TERMINALFOUR version | Version of the product | 8.2.9 |
Details
| Item | Description | Example |
|---|---|---|
| Sections | ||
| Section | Section name and link to edit | |
| Language | Publish language | en |
| Publish time | Time to publish the section | 0.108 seconds |
| Content | ||
| Content name | Content name and link to edit | |
| Language | Publish language | en |
| Section ID | ID of the section that contains the content | 268 |
| Publish time | Time to publish the content | 0.041 seconds |
| Navigation objects | ||
| Navigation object | Navigation object name, id and link to edit | Children or siblings id: 2 |
| Language | Publish language | en |
| Usage count | Number of times the navigation object was used | 144 |
| Average publish time | Average time to publish the navigation object | 0.001 seconds |
| Tag brokers | ||
| Broker | Excel To HTML Broker | |
| Language | Publish language | en |
| Usage count | Number of times the tag broker was used | 3 |
| Average publish time | Average time to publish the tag broker | 0.011 seconds |
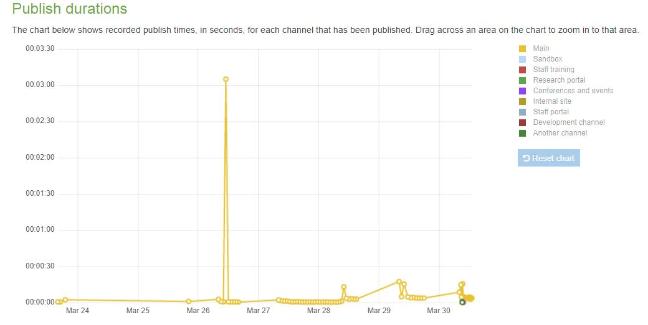
Publish durations
A chart shows recorded publish times, in seconds, for each channel that has been published. Drag across an area on the chart to zoom in to that area.
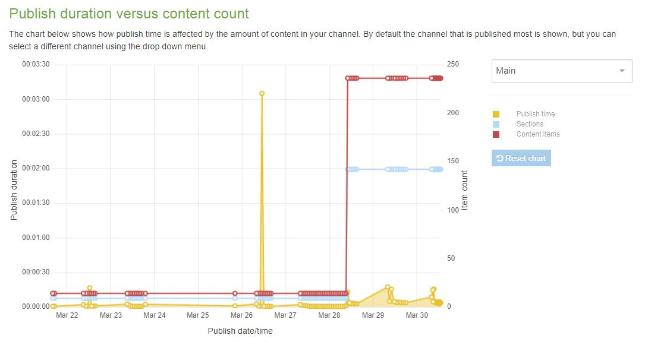
Publish duration versus content count
A chart shows how publish time is affected by the amount of content in your channel. By default the channel that is published most is shown, but you can select a different channel using the drop down menu.